Articles
- BLOG / Articles / View
- Articles
Enterprise Subscribers: Outlook for U.S. Oil Production in 2026
By Osama on February 10, 2026 in Market Sentiment

This report evaluates how the U.S. completions landscape is positioned for 2026 by linking three sources of evidence: the behavior of Primary Vision’s Frac Spread Count and Frac Job Count through 2025, forward-looking activity projections from EFRACS, and the guidance shared by leading operators and major global producers. The aim is to provide a clear, data-grounded view of how the sector is likely to perform in a year shaped by moderate prices, efficiency-driven operations, and restrained capital plans across much of the industry.
2025 Recap - Frac’ing activity showed exceptional strength against a highly volatile oil market
The behavior of Primary Vision’s Frac Spread Count and Frac Job Count through 2025 provides the clearest window into how U.S. shale adjusted to a year defined by softer prices, uneven global demand, and a steady return of OPEC+ supply. The relationship between lower prices and U.S. shale activity was further explored here.
A second theme that shaped the year is the shift toward higher utilization and greater efficiency within a smaller fleet. Our analysis notes that despite the fall in spreads the amount of work performed per spread continued to rise. Activity was consolidating around larger, more capable fleets, while older units were being sidelined. That trend remained visible throughout October as rigs continued to decline but new-well production per rig rose across most basins. The capacity to sustain national output despite fewer active spreads reflects the structural changes underway in completions design, logistics, and fleet composition. Operators’ ability to concentrate horsepower into fewer, high-intensity operations is becoming a defining attribute of the sector.
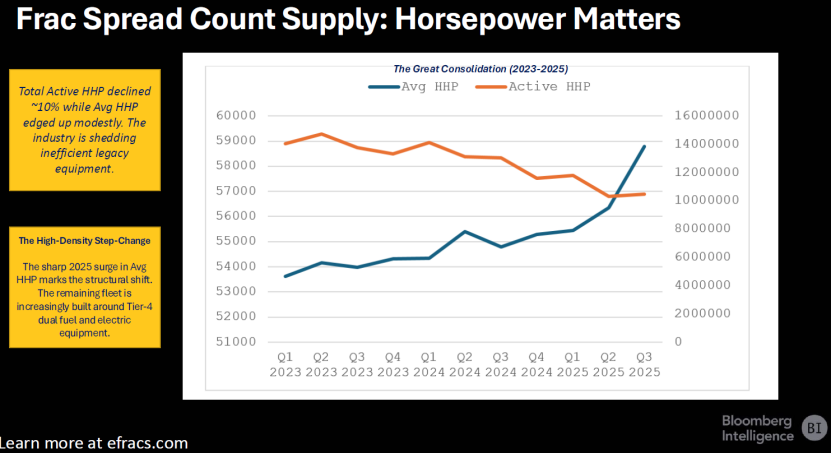
Source: Third Party Opinion, Primary Vision’s Webinar with Bloomberg, 10th Dec’25
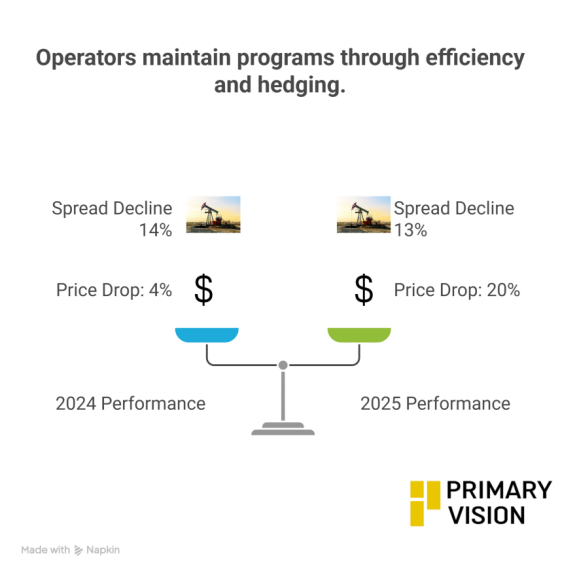
Another notable feature of the year is the reduced elasticity of completions to price weakness. Historical cycles often saw spreads contract rapidly when WTI dipped below $60. In contrast, our analysis showed that in 2025, spreads declined by 13 percent even though prices fell around 20 percent. The contraction was smaller despite a sharper decline in prices. This illustrates that operators are increasingly maintaining consistent programs supported by efficiency gains, hedging strategies, and a broader cost base that allows them to operate through price softness.
Outlook for Frac’ing in 2026 - What does EFRACS show?
The stability illustrated by the FSC and FJC through 2025 provides a useful baseline for assessing the current year. Efficiency gains, concentrated horsepower, and disciplined completion programs now anchor field behavior, while the limits of legacy production, changes in operator guidance, and the evolving cost environment will shape how much of that stability can be carried forward. With those elements in place, the next step is to evaluate how operator plans, basin-level trends, global macro conditions, and EFRACS forecasts interact to determine the likely range of activity and supply outcomes in 2026.
Frac Spread Count 2026 Projections - Basin level
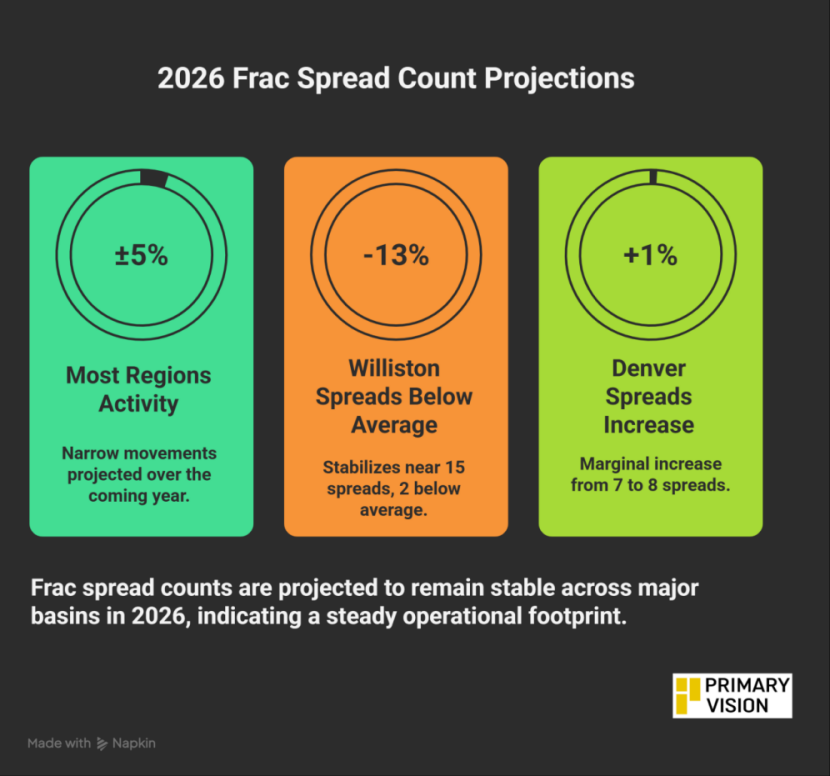
The basin-level forecasts for 2026 point to a completions landscape where the level of deployed capacity changes little. The Frac Spread Count projections for the major basins show narrow movements over the coming year, with most regions holding within a ±5 percent range of current activity. In the Permian, the forecast centers around 78 spreads, which is broadly consistent with the roughly 75–80 spreads active through late 2025. The Williston stabilizes near 15 spreads, only about 2 spreads below its trailing twelve-month average. The Western Gulf remains close to 17, within 10 percent of its recent operating range. Denver shows a marginal increase of roughly one spread, moving from near 7 to about 8. These modest adjustments indicate that operators are not preparing for meaningful expansion or contraction in capacity. Instead, the spread count projects a year where the industry maintains a steady operational footprint.
Frac Job Count 2026 Projections - Basin levels
The job-count forecasts across most basins show a visible upward shift through 2026, with each basin’s projection rising above its recent operating range. This doesn’t correspond to higher production but highlight the higher and consistent efforts required to offset the decline.
In the Permian, FJC projections move into lower 100s, which is higher than the levels visible through 2024 and 2025 in the model. The Williston forecast averages between 12-20. The Western Gulf rises into the upper 20s and also crossing 30. Finally, Midcontinent follows the same pattern, with the forecast trending above the levels observed earlier in the cycle.
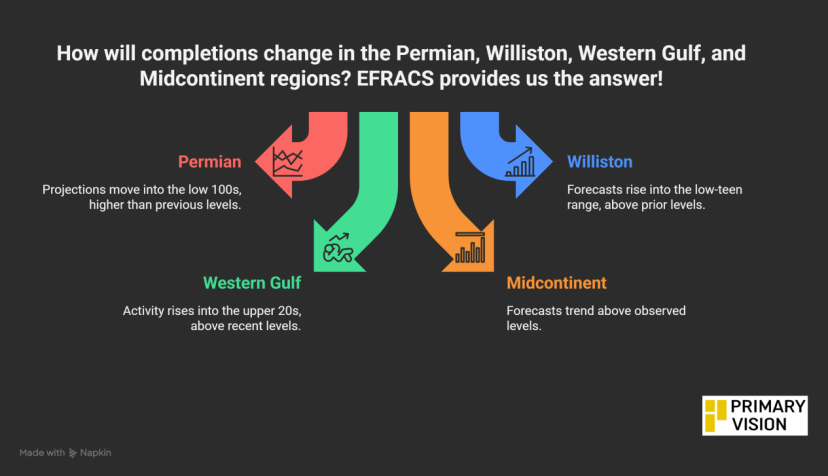
This matches the pattern observed through 2025, when national spread counts moved within a narrow band and job counts regularly exceeded 200. The forecasts extend this dynamic into 2026, suggesting continued gains in fleet productivity, logistics coordination and stage-level execution. The ability to increase completions without expanding the fleet implies that efficiency remains the primary lever through which operators plan to meet next year’s requirements and hold their ground.
Constraints and Limitations
The EFRACS projections make clear that rising frac job counts in 2026 should be interpreted as a response to tighter operating constraints rather than a signal of accelerating production growth. The binding constraint in the system is not available horsepower or fleet count, which remain broadly stable, but the rising effort required to offset steeper base declines and deteriorating inventory quality. As core acreage matures, operators must execute more completion work per unit of sustained output, increasing job intensity without expanding deployed capacity. Logistics and labor appear sufficient to support higher throughput per fleet, but they do not eliminate the underlying pressure created by higher decline rates. As a result, higher FJC reflects maintenance-driven activity—doing more work to stand still—rather than incremental supply growth.
The higher projected job counts across the basins offer a quantitative foundation for anticipating slightly stronger operational throughput in 2026 without fleet expansion. This creates a consistent base for evaluating how operator guidance, Big Oil’s 2026 plans and global macro conditions will shape next year’s completions environment.
What is the Oil Field Service Industry Thinking?
Operator-level signals for 2026 point toward a year shaped more by discipline and selective growth than by expansion. The expectations shared across recent earnings commentary show that companies are preparing for steady volumes in a moderate-price environment. Most operators are not positioning for a rapid increase in oil activity, nor are they signaling a sharp contraction. They are framing 2026 around efficiency, capital control, and targeted deployment rather than fleet additions. This mirrors the broader structure Primary Vision’s forecasts already suggest: completions activity remains stable, and any increase in job counts is expected to come from higher utilization rather than a larger operational footprint.
Some operators offer clearer visibility into 2026 than others. Patterson-UTI provides the most explicit operational direction. Management expects capital spending to be lower next year while still supporting high-demand fleet investments. That approach indicates a shift away from broad fleet growth toward selected upgrades, mainly in natural gas–aligned technologies. The company points to LNG-driven gas demand as a source of stronger activity into 2026, which fits with the expectation that the natural gas side of the market will remain more resilient than oil. There is no suggestion of higher oil-directed horsepower, but there is a consistent indication that PTEN plans to maintain its footprint and support it through efficiency tools such as direct-drive pumps and AI-enabled platforms. Lower capex paired with maintained deployment suggests a view that 2026 will require stability rather than scale.
Liberty Energy’s guidance offers a different but complementary view. The company expects global oversupply to peak in early 2026, followed by an improvement in activity as balances tighten. Liberty also anticipates equipment attrition to continue reducing excess capacity, helping restore pricing strength across pressure pumping. These statements imply a more constructive demand environment in the second half of the year, which may support higher throughput without meaningful additions to the active fleet. Liberty’s emphasis on efficiency gains from its digital and automated systems also reinforces the broader theme: companies expect to do more work with the same or even smaller capacity. The strong demand it forecasts for next-generation pumping systems points to continued customer interest in high-efficiency fleets, but there is no indication of a large-scale reactivation cycle. The tone of Liberty’s outlook is measured optimism anchored in technology and attrition rather than in higher commodity prices.
ProFrac’s outlook centers on structural adjustments rather than activity changes. Management targets $85–$115 million in annual cost savings by the second quarter of 2026. The company also highlights ongoing natural equipment attrition as a factor tightening the pressure pumping market. These points suggest that ProFrac views 2026 as a year where margin improvement and operational discipline remain priorities. While ProFrac comments on an improving activity environment in the near term, it does not provide explicit activity guidance for next year. Its focus on cost reductions and resilience implies that the company expects the broader market to remain balanced and competitive rather than to expand materially.
When companies with global exposure view 2026 as a year of offshore-led recovery, it suggests that U.S. onshore will continue operating in a measured, efficiency-driven mode.
KLX Energy Services, Nine Energy, and RPC provide limited or no explicit guidance for 2026. KLX offers only near-term Q4 expectations. Nine signals tightening liquidity through January 2026 but does not comment on activity beyond that point. RPC acknowledges forward headwinds but does not provide a view on next year’s deployment, demand, or margins. The absence of guidance itself is informative. Smaller service providers appear cautious and focused on navigating the current environment rather than projecting stronger activity next year. This cautious posture aligns with a completions market that remains stable but not expansive.
Across all operators, the common thread is restrained planning. Companies with stronger balance sheets are preparing for selective investment in high-demand technologies, while companies with weaker positions are focused on cost control and liquidity. Almost none expect a surge in U.S. oil-driven completions. Instead, they frame 2026 as a year defined by steady operations, incremental gains in throughput, and a more constructive environment for natural gas. The more confident views hinge on equipment attrition, efficiency improvements, and gradual tightening in market conditions rather than on price-driven expansions.
Taken together, these signals reinforce the structural outlook already visible in FSC and FJC forecasts. Operators expect to maintain their existing fleet levels and rely on higher utilization to meet demand. Activity is not projected to weaken sharply, but neither is it projected to rise through large capacity additions. The operator-level guidance points to a 2026 completions market that is stable, disciplined, and led by efficiency, with natural gas providing more upside than oil. This gives a consistent foundation for integrating macro, price, and Big Oil considerations in the next section of the 2026 Outlook.
What about CAPEX and other plans?
Major integrated producers and international oil companies are largely signaling a modest increase in aggregate production for 2026. According to a recent industry estimate, the group including ExxonMobil, Chevron, Shell, BP and TotalEnergies is forecast to increase output by roughly 4.7 percent in 2026. This suggests that, even if oil prices remain under pressure, these firms plan incremental growth—likely leveraging new projects and asset acquisitions rather than broad upstream spending booms.
This planned output growth comes despite a challenging macro backdrop. Recent forecasts see global oil supply outpacing demand growth in 2026, indicating a potential surplus. That structural overhang may limit upward price pressure, but the majors appear willing to push production volumes anyway—possibly betting on their scale, diversified asset base (including offshore and international projects), and integrated downstream margins to buffer returns.
On the capex and investment front, there is divergence across firms. Some majors are reportedly reducing early-stage capex programs in favor of acquisition activity and project optimization. According to a recent note, ExxonMobil may scale back early-stage investment even as it hunts acquisition targets. For upstream-heavy producers outside the U.S., the ride may continue: firms such as Abu Dhabi National Oil Company (ADNOC) are mobilizing large capital programs for the period 2026–2030. ADNOC’s board recently approved a US$150 billion investment plan spanning that period, signaling growth and reserve additions.
These investment strategies suggest a bifurcated dynamic. Onshore-focused companies—especially those with high decline rates and pressure-pumping service demand (i.e. the focus of U.S. completions vendors)—may not see a broad capex rebound. Instead, growth will come through offshore developments, international shallow-water or deepwater projects, and consolidation/acquisition plays where scale and lower break-evens matter more than volume spikes.
Given these signals, 2026 seems likely to deliver modest output growth from Big Oil, but at a pace that reflects caution. The roughly 4–5 percent output increase projection is modest relative to past cycles. It suggests that majors are not expecting a dramatic price rebound or a return to high-volume drilling cycles in U.S. shale. Instead, they appear to be banking on diversified portfolios—with offshore, international, and conventional assets offsetting onshore softness.
For the U.S. completions ecosystem, this outlook carries two broad implications. First, because major upstream players are not signaling a shale-driven capex boom, demand for completions crews, pressure-pumping, and service providers may remain tied to efficiency gains and replacement drilling, rather than a surge of new wells. That reinforces the structural shift already visible in your EFRACS forecasts and operator-level guidance. Second, as Big Oil leans more on offshore and international development, competitive pressure may tighten globally, making cost control, operational discipline, and service-cost efficiency even more important for sustaining margins across the service chain.
In sum, Big Oil’s public plans for 2026 point to cautious growth plan not a rebound. Across the major integrated producers, moderate output increases, restrained upstream capex, and a tilt toward lower-cost offshore/international assets shape the forecast. Growth will likely be incremental and diversified, not aggressive and shale-centric. For the completion-services sector, this suggests demand won’t shrink sharply, but neither should there be an expectation of a large uptick driven by U.S. onshore shale reactivation. The next 12–18 months look set to be defined by discipline, not scale.
Tags:
Permission denied
Upgrade to Pro Today and get…
• This article — plus dozens more each month, all within our full Research Module
• Frac Hits — our National-Level Frac Spread Count and Frac Job Count, updated weekly
• Frac Operator Monitor — detailed FSC & FJC by operator
• And so much more, designed to help you track, forecast, and outperform