Articles
Why Are There So Many Grades and Different Prices of Oil?
By Osama on March 19, 2026 in Free Articles
Written by: Osama Rizvi and Avik Bhanja Chowdhury
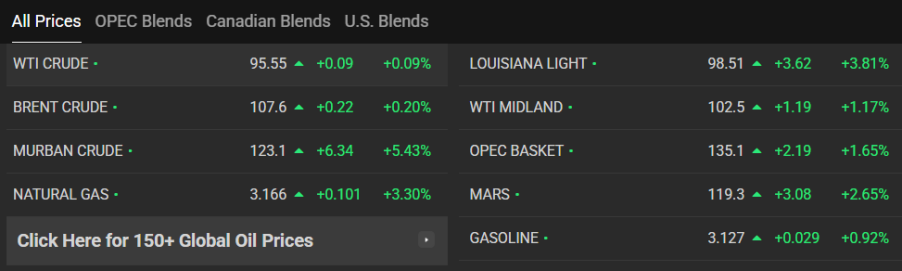
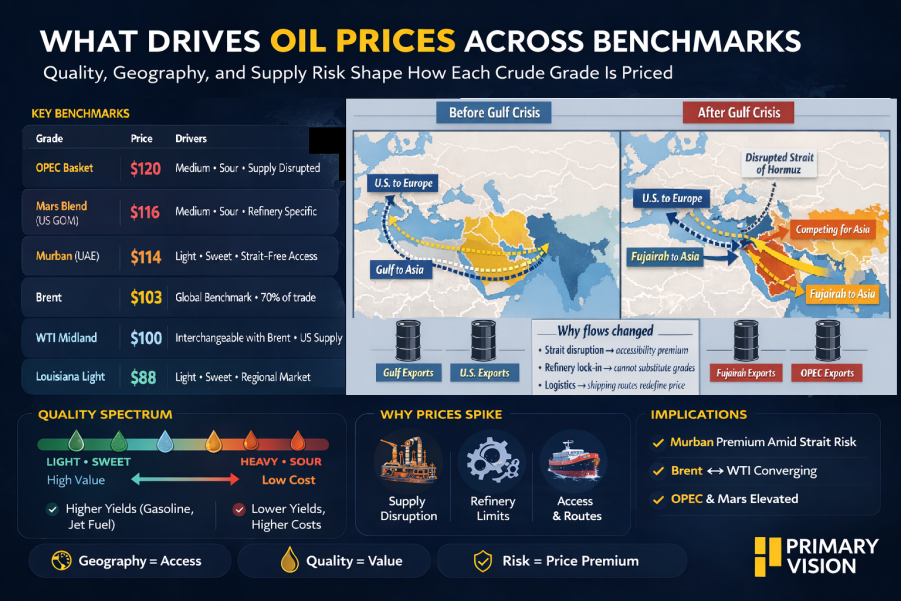
When people say "the oil price," they almost always mean Brent - sitting around $103 right now and the reference point for roughly 70% of all crude traded globally. But open a proper price screen and you'll find a dozen different numbers. The OPEC Basket is above $135. Mars Blend is at $119. Murban is at $123. Louisiana Light is at $98. These gaps aren't random - each one tells you something about the crude itself, where it comes from, and who needs it.
The biggest driver is quality. Crude is not one thing - it's a spectrum. Light, sweet crude is low in sulfur and refines easily into gasoline and jet fuel. Heavy, sour crude is thick, expensive to process, and trades at a discount. That's why Louisiana Light sits at $98 despite sounding premium - it's priced for a specific regional market, not the global one.
Geography matters just as much. WTI Midland trades almost level with Brent because since 2023, the two are physically interchangeable - more than half the time, a Brent contract delivers a WTI Midland barrel. The $5 gap is just the shipping cost from Texas to Rotterdam. Murban is the most interesting right now. It's high quality, but the bigger reason it commands a premium is geography - it ships through ADNOC's Fujairah terminal, bypassing the Strait of Hormuz entirely. With the Strait effectively closed, Asian refiners are paying up for any barrel they can actually receive. Murban is one of the very few available.
Mars Blend tells the starkest story among medium, sour crudes. The OPEC Basket, meanwhile, is a broader benchmark made up of multiple OPEC crude streams, many of them heavier and more sour than Brent. Refineries built to process these specific grades cannot simply switch overnight - their equipment is configured for a particular crude diet. When those barrels disappear, prices spike. That's not speculation. That's desperation.
History is worth a quick look here. After Iraq’s invasion of Kuwait in 1990, crude prices surged sharply within weeks as the market saw a broad global supply shock. By contrast, the 2003 Iraq invasion had a much smaller effect on price differentials, because wider Middle Eastern exports stayed largely intact. When war threatens a broad share of global supply, it tends to lift oil prices across the board. When it threatens a specific region, crude grade or shipping route, it tends to create more uneven moves and wider gaps between benchmarks.
The current Iran conflict is firmly in that second category. It isn't producing a uniform global price spike. It is generating a regional risk premium concentrated on Gulf exports and the Strait of Hormuz - which is exactly what the spread between Murban, Brent, and WTI is telling you right now. But the impact spills over to all grades. The simplest way to read any crude price screen: the more a grade is trapped inside the disruption, and the harder it is to replace, the higher it goes. The headline price tells you something. The gaps between benchmarks tell you everything.
Historical context
Historical conflicts reveal how differently oil markets can respond to geopolitical shocks. The 1990 Gulf War, triggered by Iraq’s invasion of Kuwait, produced one of the sharpest oil price spikes in modern history. Prices roughly doubled within months as markets feared the loss of a significant share of global supply. During this period, benchmarks such as Brent and WTI largely moved together. The market interpreted the conflict as a broad supply shock rather than a regional disruption. However, the spike proved temporary. Once coalition forces secured oil infrastructure and exports resumed, prices retreated.
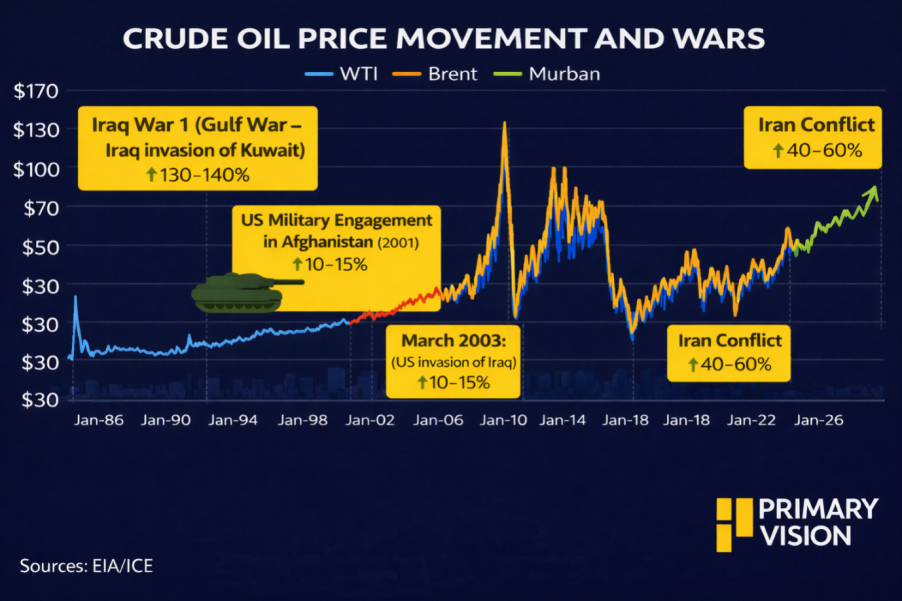
The 2001 U.S. military engagement in Afghanistan produced a very different market reaction. Rather than reflecting supply disruption, the price movement was driven by macroeconomic uncertainty following the September 11 attacks. Oil prices fell sharply during the initial months as traders anticipated weaker global demand. Benchmark spreads remained largely unchanged. The 2003 U.S. invasion of Iraq generated a more muted supply response. Prices moved modestly as markets evaluated potential risks to Iraqi production. But once it became clear that broader Middle Eastern exports were unlikely to be interrupted, prices stabilized. Benchmark spreads again remained relatively stable, indicating that the market viewed the disruption as contained.
For traders and analysts, the key takeaway is clear. The headline price of oil tells only part of the story. The real signal lies in how benchmarks move relative to one another-and in the spreads that emerge when geopolitics reshapes the flow of global crude.
Tags: