
The Strait of Hormuz limitations have created significant challenges for the global energy markets. We’ve already discussed how fertilizers will be impacted based on flows and feedstock limitations into core markets. There has been some ship traffic through the “approved” Qeshm-Larak channel, but the size, scale, and quantity of the volume is still very small. Other vessels are running “dark”, but those are few and far between. Many shipping companies are opting to comply with Iranian “toll approvals” rather than risk running the strait. India was one of the first to receive some level of passage, while they’ve also increased their purchases of Russian crude. Even as some volumes start to move, diesel, LPG, and natural gas (LNG) are the ones to watch as they impact large parts of everyday life.
- Diesel moves everything around the world while the “key” crude slates are stuck in the Middle East
- LPG is one of the most flexible molecules in the world because it can go in almost anything. It can:
- power a truck or bus
- provide back-up generation for power
- be the feedstock for a petrochemical facility, as well as used to power the cracker
- utilized at home for cooking and heating
- Natural Gas (LNG) is key for power plants, industrial use, electricity generation, and trucks
The above items are at the crux of every part of the supply chain, and shortages of these products will be a core driver of inflation as companies ration and governments restrict exports.
The energy markets have been in a massive state of flux, and the biggest impacts we’ve highlighted are natural gas and products. We put together a piece looking at natural gas/ LNG, and how it impacts the fertilizer markets. The LNG market has only gotten worse since we wrote the initial insights, and it’s important to provide an update before we move into NGLs (natural gas liquids) and refined products.
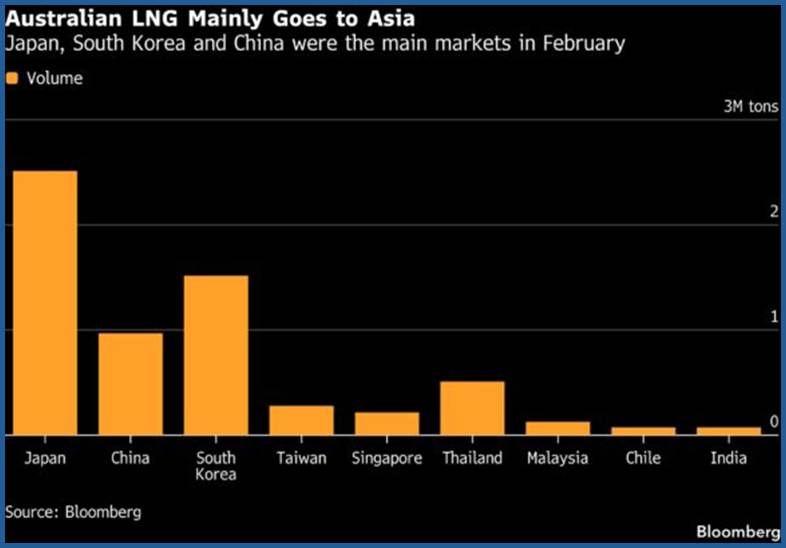
Cyclone Narelle hit Australia at the end of March, resulting in broad outages across their LNG capacity. Wheatstone, Gorgon, and Woodside all experienced power outages, shutting down operations with some residual damage reported across the facilities. The facilities were still struggling to bring power back as personnel were mobilized. A large part of their production is sent to Japan, China, and South Korea—countries that are all struggling with the loss of Middle East volumes.[1]
Qatar provided an update with Force Majeure declared through May, and we expect to see a large part of FM declared over the next several years on contractual volumes. Structural damage has been announced on several trains, impacting output that Qatari Gas says could take between 3–5 years to return to normal operation. Given the size and scale of these trains, we believe this is a factual statement for several reasons:
- These trains range between 8–10 MTPA
- The equipment on trains of this size are highly specialized and take years to source and build
- There is a slew of new LNG facilities being built, so Qatari Gas will have to “get in the queue” to get the equipment they require. The wait time alone could be well over a year.
- There are about 30 LNG facilities under construction that Qatar will have to compete with for equipment, engineering, and construction.
None of this can begin until the Middle East conflict ends, which will only make the LNG shortages much worse.
- There are about 30 LNG facilities under construction that Qatar will have to compete with for equipment, engineering, and construction.
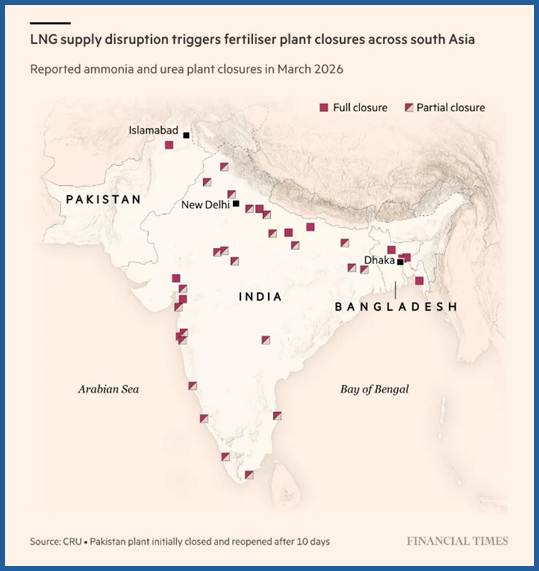
There have already been huge shifts around the world, with more petrochemical and fertilizer companies announcing run cuts or shutdowns due to lack of feedstock. This chart of India helps show the reduction in utilization rates or outright closure of facilities.
A partial closure needs to be defined because a refiner and petrochemical facility require a minimum volume and pressure gradient. They can typically only go to 65%–67% utilization rates before they have to be completely shuttered. If they have some separation of processing, they can dip to as low as 60%, but those types of facilities are not very common. So, anything getting close to that 65% number is likely on the verge of shutting down.
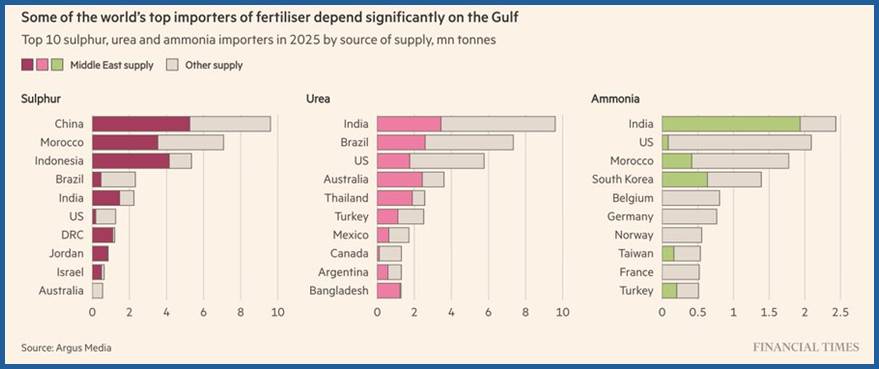
When you consider who is the largest importer of fertilizer, you can understand why it’s so important. India, Brazil, and the U.S. are some of the largest food growers in the world, and if they have yield declines or production drops, the world suffers.
The broader economy needs diesel to operate at every point along the supply chain. The increase in diesel and gasoline is always a huge leading indicator for “flexible” inflation. It will be one of the largest drivers of the next iteration of pricing, and it usually leads food/ agriculture inflation by several months. If we just used the World Bank’s fertilizer math, every 1% rise in fertilizer prices translates to a .45% increase in food commodities prices.
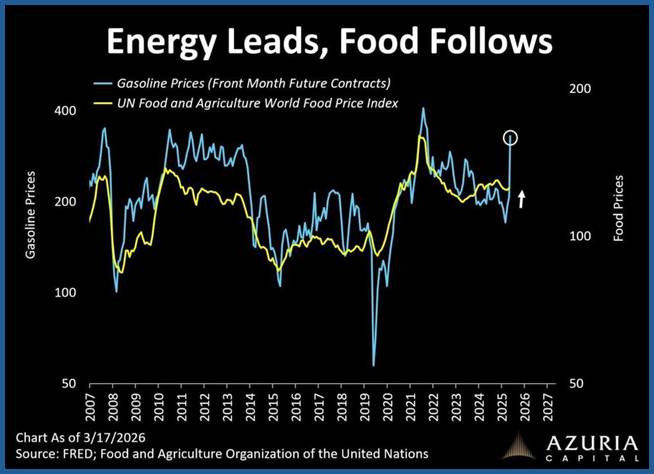
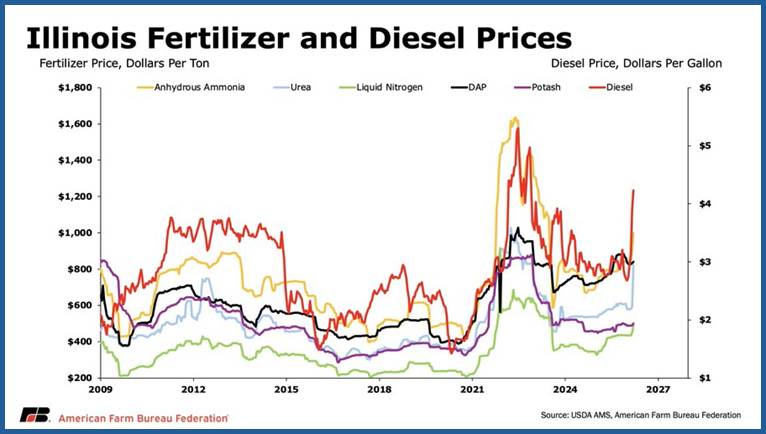
The consumer has already been struggling, and this will be another huge hit—especially as we head into the summer months. The world is currently sitting in “shoulder season,” when refiners are doing their maintenance prior to the surge in demand that normally kicks off Memorial Day weekend (May 23rd–May 25th). The peak of summer travel is usually July 1st– July 20,th with a gradual slow down in August, ending around Labor Day (September 7th). The availability of diesel and gasoline are the biggest issue at hand. Instead of seeing builds across the world, we are seeing broad shortfalls and rationing already playing out. Every country is facing a very similar dynamic as the one highlighted in this chart featuring Illinois. The benefit in the U.S. is taht we can still get access to these products. They’re at significant premiums, but still available.
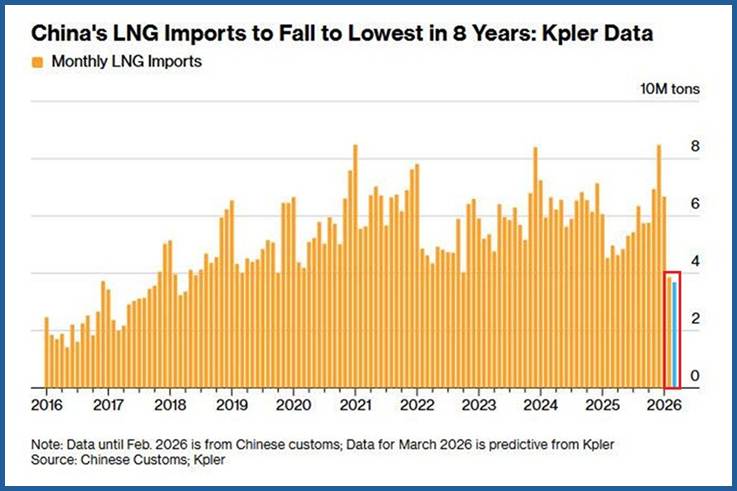
As we look abroad, countries are unable to get their normal allotment of natural gas, which is driving them to alternatives. As an example, China is only going to import 3.69M tons in March, which is the smallest amount since 2018. China has already announced restrictions on exports of refined products and fertilizer, and we could likely see other limitations on everything, especially petrochemicals.
The problem many countries have is sourcing the right slate of crude to make the appropriate refined products. The U.S., China, and Middle East require a heavy slate based on their configuration.
In 2014, the Middle East countries began reassessing their downstream portfolio with a focus on exporting “higher value” hydrocarbons instead of just oil. Over the past 12 years, they have constructed and expanded a ton of capacity with a focus on “middle distillate,” especially diesel.
The world began to rely on the Middle East at a growing pace as China failed to export product to the levels initially expected, and Ukraine started to successfully strike Russian refiners.
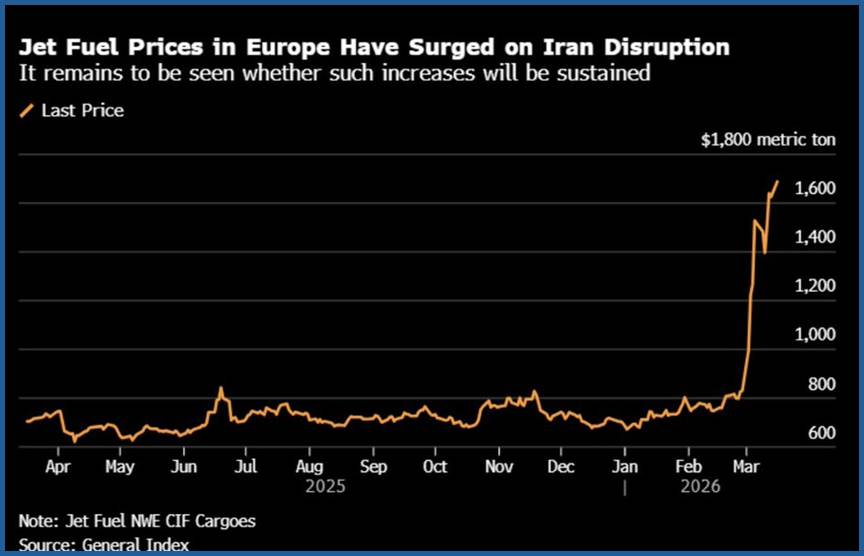
Europe struggles with competing Asian buyers as sanctions, geopolitical turmoil, and impaired capacity limit the amount of product available. It’s no surprise to see a huge surge in jet fuel prices in the region, and there will be additional pressure in diesel.
The reason Asia is competing so fiercely for refined product is driven by the loss of LNG and NGLs (natural gas liquids). The Asian buyers are struggling to source their own capacity, but Australia seems to be impacted more than most.
- Fuel prices in Australia have surged to all-time highs, with diesel at A$2.82 per liter and petrol at A$2.38 per liter.
- In Asia, jet fuel prices have surged +140% in Singapore and +114% in Europe since the Middle East Conflict began, forcing Vietnam Airlines and Air New Zealand to cancel flights due to limited supply.
Governments are taking action by restricting exports, imposing export tariffs, cutting fuel taxes, rationing fuel, and cutting flights.
- India has imposed export taxes on diesel and jet fuel to keep domestic supply stable, at an estimated annual revenue loss of ~$16.4 billion.
- Thailand is rationing diesel as demand has jumped to 87 million liters per day, up +30% from the pre-war average of 67 million liters.
- Japan is relaxing rules to increase coal-fired power generation
- Asian governments are burning through subsidies at an unsustainable pace, with Thailand's oil fund already in deficit and Vietnam's expected to be fully drawn by early April.
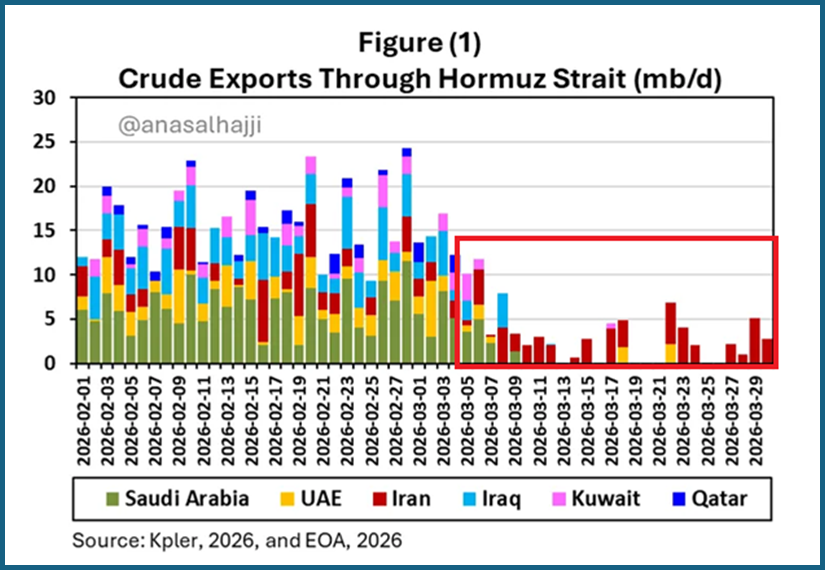
To add insult to injury, Valero experienced an explosion and fire at their Port Arthur refiner, reducing total throughput. Countries are also working out some sort of deal with the Iranian authorities to enable some flows. In following charts, we show “flows through Hormuz” that show an increase in volumes. These are signified as only being Iranian, but other countries have been able to negotiate some sort of passage. The vessels are typically traversing with their AIS transponders turned off, so they aren’t being properly accounted for in the data. While this signifies that there isn’t a complete closure, the volumes of sailing don’t even come close to what it was before the conflict. A few tankers doesn’t address the 90-120 vessels that used to sail per day.
At the peak of the Strait of Hormuz closure, there have been broad strikes on producing fields, processing and refining complexes, and storage and logistic equipment. These incidents will have lasting impacts, even after the Strait of Hormuz reopens and some normalcy returns to the region.
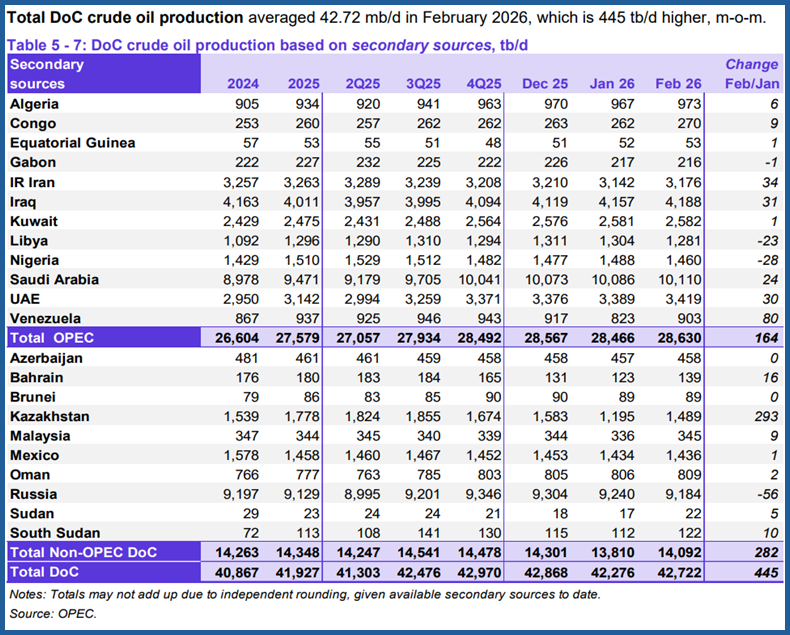
The Middle East produces about 26–30M barrels of oil a day, or around 30% of global oil production. This chart gives a breakdown of production coming from OPEC, with the majority originating in the hotly contested region.
There’s an estimated 8.2M barrels a day offline:
- Iraq – 3.3M barrels a day
- Kuwait – 1.3M barrels a day
- UAE – 1.56M barrels a day
- Saudi Arabia – 2M barrels a day
The lack of supply is tightening the market considerably, with limited barrels flowing to clients. There have already been a sweeping amount of force majeures declared.
Saudi Arabia has turned on their “East-West” pipeline to export from the Yanbu Port in the Red Sea instead of the Persian Gulf. All of the crude out of the Red Sea has been slated to go to Asia.
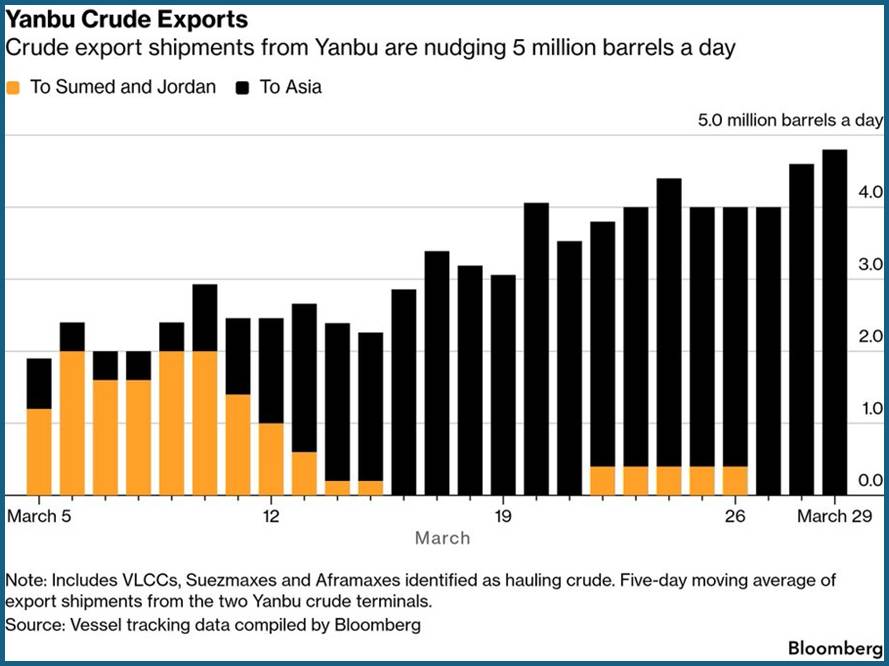
The pipeline doesn’t replace the total amount lost through the Strait of Hormuz, but it does help get some product into the market. The 1200 km pipeline can move about 7M barrels a day, with the expected breakdown of volumes:
- 5M barrels of oil for export
- 700–900k barrels a day of refined products
- 2M barrels a day sent to Saudi refiners
There is also a parallel line (Abqaiq-Yanbu NGL Pipeline) that carries about 290k barrels a day of natural gas liquids. This was already serving petrochemical facilities in the region, and it’s unlikely we see any type of uplift on NGL exports.
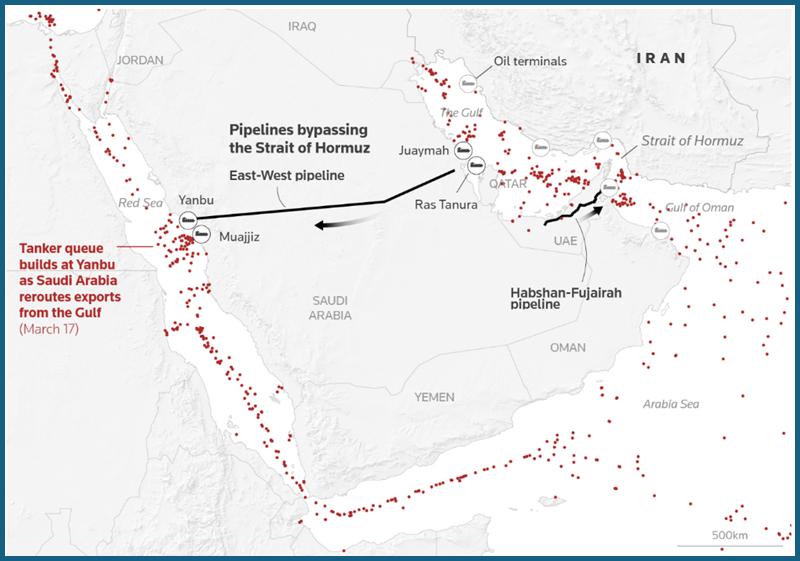
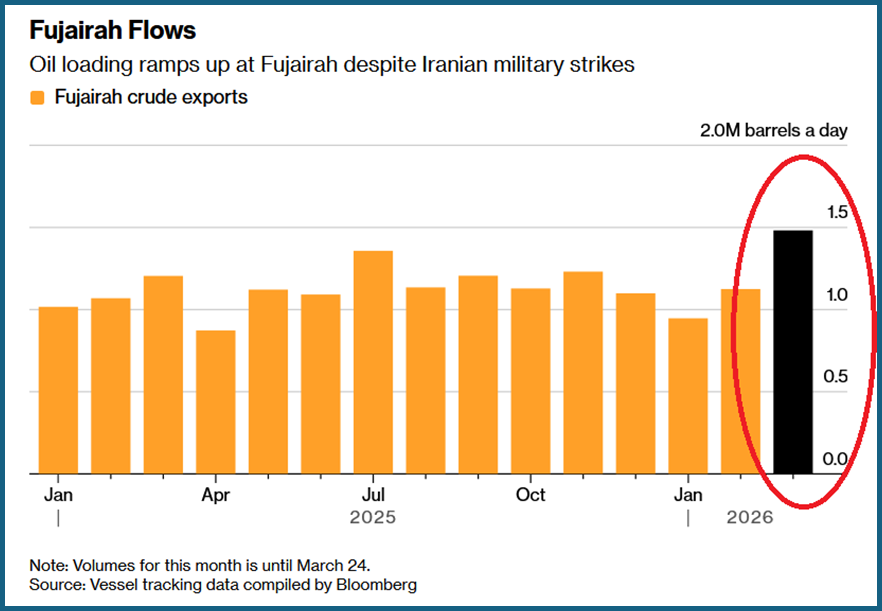
In the UAE, they have the Habshan-Fujairah Pipeline that can also get around the Strait of Hormuz. The pipeline is built to handle about 1.5M barrels a day of capacity (1.8M with a surge), and it sends crude to Fujairah for export. But Iran has struck several pump stations on the line, slowing down exports for the time being. There have not been any clear reports on how bad the damage is to these facilities. We do know that the flows have stopped for the time being, which will keep the market VERY tight.
Crude loading at the port of Fujairah had surged to ~1.9 million barrels per day in March 20–24, which is +57% above the annual average of ~1.2 million bpd. However, Iran has attacked Fujairah at least 7 times over the last 4 weeks, destroying storage tanks and damaging key loading infrastructure. Despite the strikes, crude loading has resumed, but refined product exports remain limited due to damaged loading infrastructure.
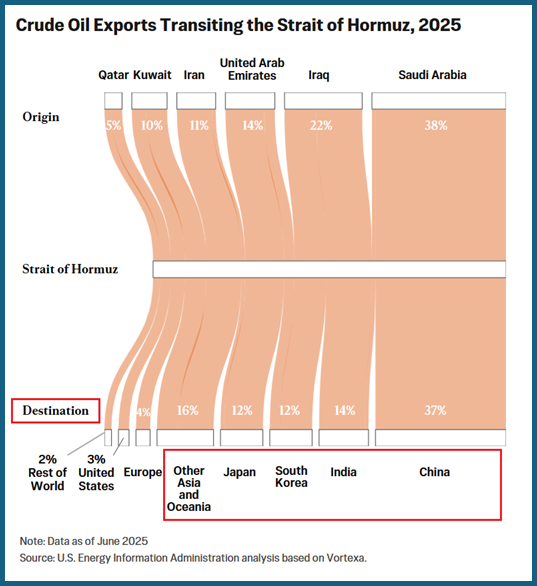
This is a good chart breaking down total flows through the Strait.
While oil and natural gas catch all the headlines, I’ve been focused on the ones that normally slip from the front page: fertilizer and NGLs. The market has finally caught up to the fertilizer story, but there is still very little being talked about in natural gas liquids.
Here’s a quick summary of exports from the region:
- KSA – 735k barrels a day
- Qatar – 318kb/d
- Kuwait – 144kb/d
- UAE – 126 kb/d
- Iran – 85 kb/d
On the U.S. side, we export about 2.9–3.1M barrels per day, with most of its LPG (Liquid Petroleum Gas) at 2.3–25M barrels a day.
When we step back and look at demand, India purchases about 60% of their NGLs from the Middle East. China swings between the U.S. and ME depending on pricing, but they’ve been pulling more from the Middle East region since the end of COVID. Japan, South Korea, and Southeast Asia are typically very consistent buyers from the Middle East as well.
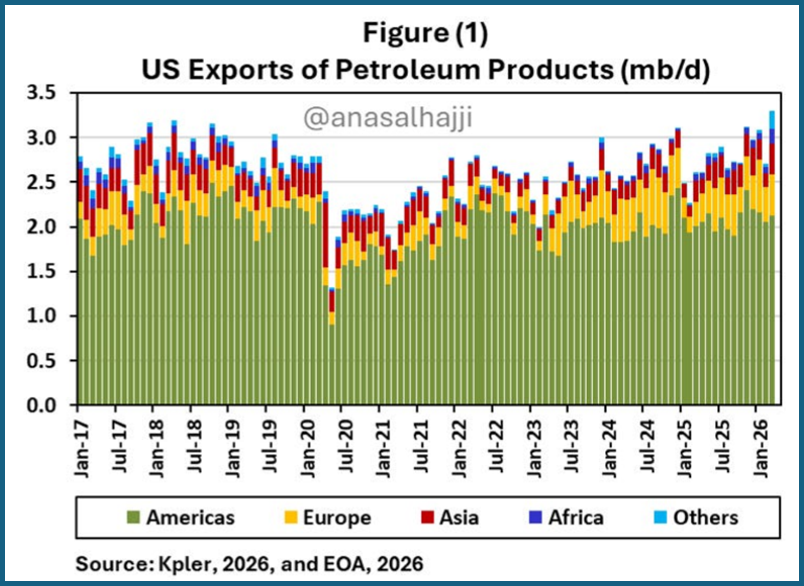
On a structural basis, India relies the most on NGLS in the region that find their way into everything from petrochemicals, fuel, heating homes, cooking, and other internal end markets. The U.S. is the biggest winner in these broad shifts given our ability to export into the market. The problem is total volume availability because the U.S. only has so much processing capacity as well as limited port capacity. While the U.S. has a ton of protected harbors, many of them are one way only, which slows the total export process.
Even with these limitations, there is an ability to increase exports to a degree. It’s no surprise to see a spike that will likely last until the Middle East conflict ends or the Strait is reopened. I expect to see the “Red” and “Yellow” bars increase as more product gets purchased away from the Americas.
- U.S. exports of petroleum products have risen to their highest level in history
- U.S. naphtha exports have risen to their highest level in history
- U.S. liquefied natural gas exports have risen to their highest level in history
- Venezuela's exports have risen to their highest level in 6 years
- United States is the world's largest helium producer and is now preparing to compensate for all the helium exported from the Gulf
The interesting backdrop in this whole process will be the cost of natural gas in the U.S. As E&Ps target more oil, condensate, and NGLs, there will also be additional natural gas production that will keep prices depressed in the U.S. We aren’t talking about $2 an MMBTU, but we will likely see sub $3 until we get out of shoulder season. Natural gas is more of a “by-product” in some of these wells, and given the price of WTI, it will continue to flow at elevated levels.
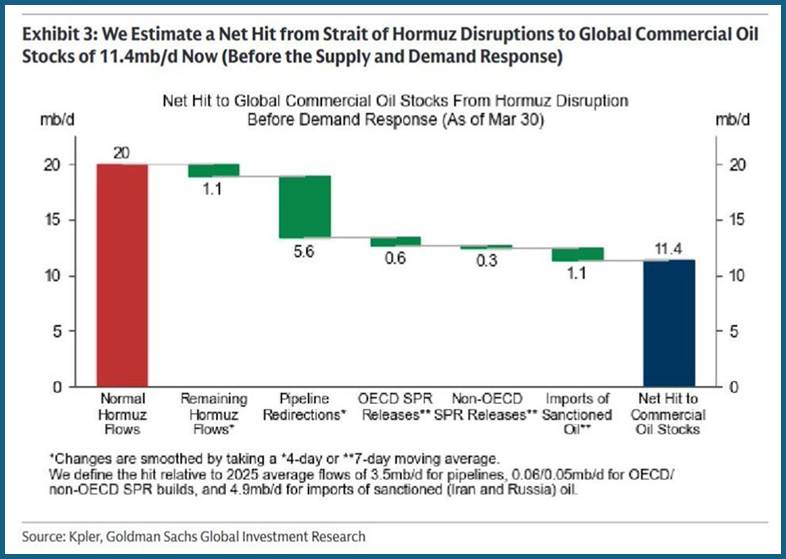
The physical market is also telling you that futures are lagging behind the true tightness in the commodities world. While there are about 2B barrels sitting in global storage, that doesn’t mean there isn’t a rapid draw down depending on the country. On average, commercial oil stocks are declining about 11.4M barrels per day once you factor in supply chain and logistical shifts. Above ground storge (or visible) has fallen by 130M barrels since the start of the ME conflict; Europe and Australia have been hit the worst to date. Things are getting much worse in Southeast Asia as well, especially because they don’t have storage reserves like other nations.
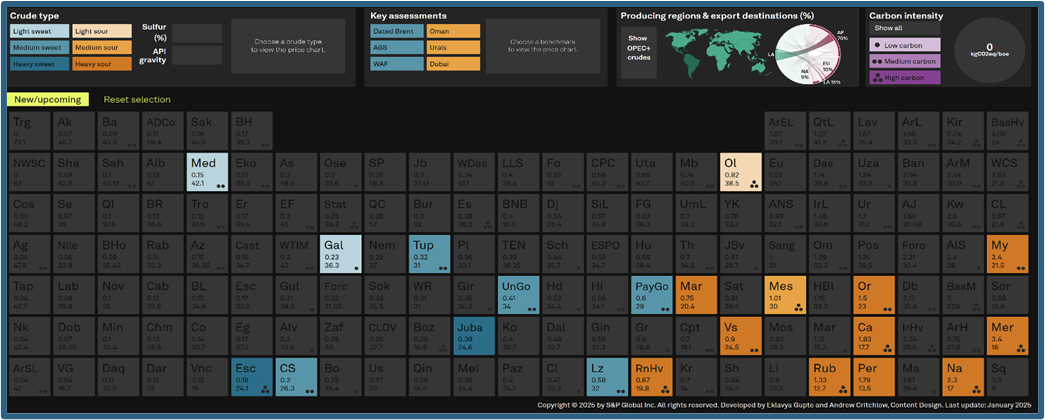
There are about 180M barrels sitting in tankers ready to head to the market, but it still takes time for them to reach the desired destinations. The growing issue is the availability for the “right” slate of crude to make the necessary product. Refiners in the U.S., Middle East, and China were designed to handle a heavier API—something between 30–33 gravity. A large portion of this crude originates from the Middle East. The shaded barrels show the average API, which is on the heavy side of the map.
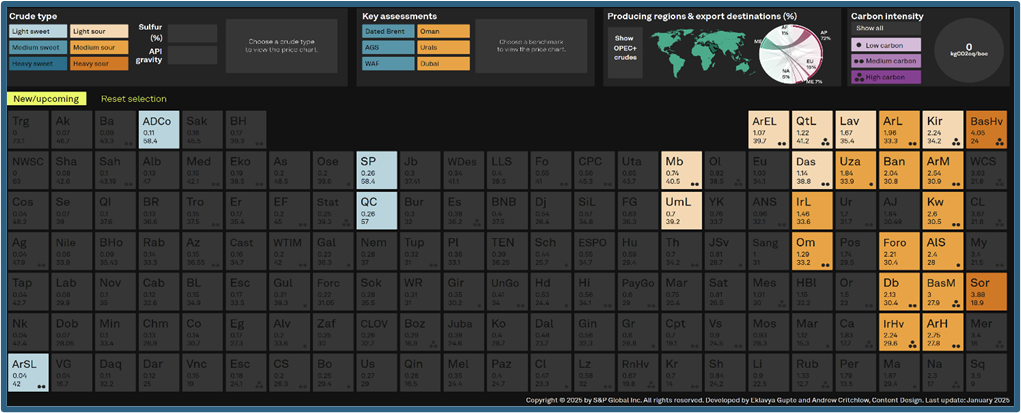
There is optionality for African crudes to replace some of these barrels, but there is still a total limit for the amount that can be produced and shipped. So while they can attempt to increase, it will still fail to even remotely touch the missing Middle East barrels.
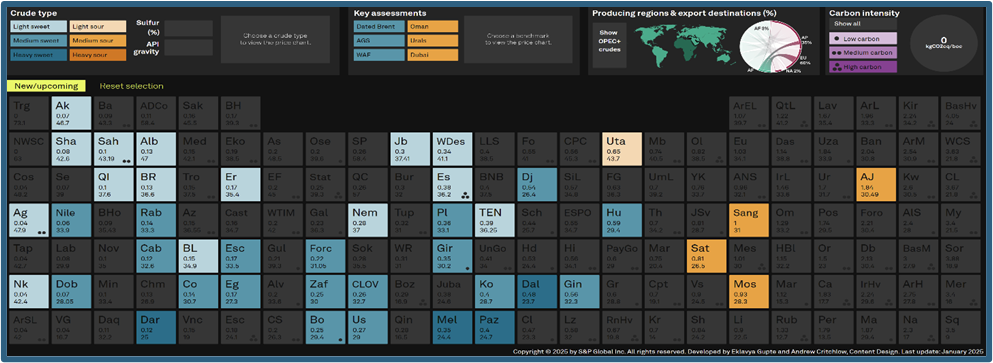
While the U.S. produces a significant amount of crude, it is in the “wrong” API category so we still require imports. We’ve been relying heavily on Canadian and South America to fill the void. With the pivots in Venezuela, the U.S. is importing more of this crude in an attempt to address these shortages as Middle East crude normally flows into the Gulf.
The biggest losers in this backdrop are Europe and China as they are struggling to fill the void of product. China has instructed refiners to maintain refined product production at 2025 levels, even if it’s at a loss. The current situation is MUCH worse than 2021–2022 because Russia is still impacted in their total exports, which had already forced countries to find alternatives and raised pricing. Europe, again, is the biggest loser as they struggle to replace volumes of crude, NGLs, LPG, refined products, and natural gas.
Natural gas storage is at critically low levels during shoulder season when we should be seeing builds to prepare for summer. If companies/countries can’t rely on natural gas, they will be forced to pivot to propane or diesel as a back-up generation and/or fuel. This will spike pricing across the board as they compete aggressively with the East Coast of the U.S. and India.
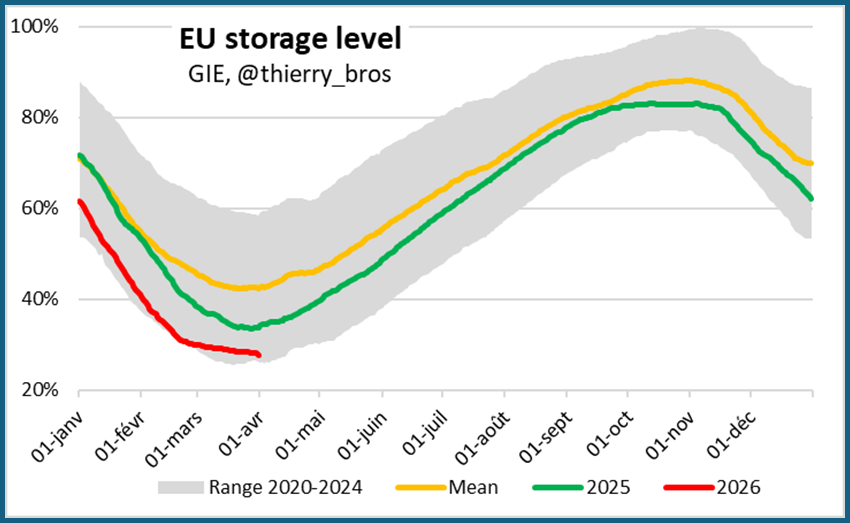
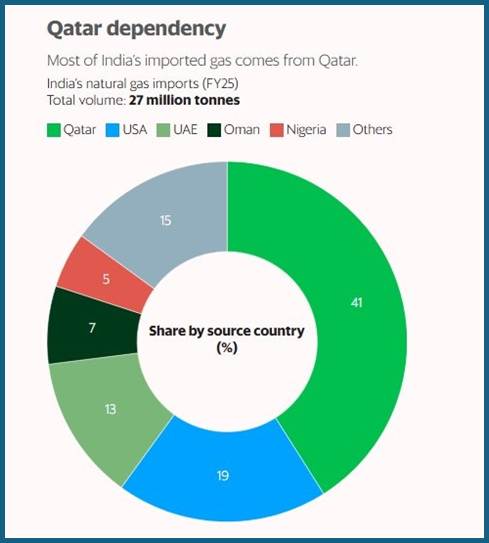
India is going to be the biggest competitor as 70% of their natural gas comes from the Middle East. Europe will have to compete for additional U.S. cargoes of everything as India tries to maintain a certain level of production.
U.S. NGLs already flow to Asia, so Europe will have to compete to “change” the direction of those cargoes. Europe was already relying more on the U.S. following the Russia-Ukraine conflict, and this has only made them more desperate at this point.
- Asia: ~60–70%
- Latin America: ~15–25%
- Europe: ~10–20%
The U.S. is going to see a sizeable competitive advantage in petrochemicals, especially as their feedstock is readily available without imports. The U.S. has shifted to ethane-based cracking over the years and away from the Propane/Butane and Naphtha based processing. China has also focused on increasing their ethane-based cracking, but the majority of their ethane feedstock originates from the U.S.
Asia- Pacific is about 50–55% of petrochemical processing with the largest being:
- China
- South Korea
- Japan
- India (which is one of the fastest growing capacity regions)
North America is about 20–25%, but we do have capacity to increase utilization rates, especially as petchem crack spreads improve.
The Middle East has been expanding their involvement in the chemicals world, with a refocus on the downstream side of processing O&G. They’ve expanded to be about 10%–15% of the market in the following order by production: Saudi Arabia, Qatar, and UAE. Qatar and UAE are currently stuck with the shutdown of the Strait, while KSA can rely on their Red Sea production to circumvent some of the restrictions. They have cheap feedstock with most of the product destined for the export market.
Europe is the one that is going to struggle as many companies in the region have considered expanding/building new facilities outside of the region. Local governments have enacted restrictions on union layoffs, while offering power and feedstock subsidies to entice companies to stay. These assets are measured in multiple decades, so a company is going to look at the long-term projection of political, feedstock, and power stability. At the moment, Europe has about 10%–15% of the market with Germany, Netherlands, and Belgium being the largest. I expect to see Europe shut down first, especially when you look at the MASSIVE surge in pricing.
As Europe reduces runs, it will free up more product to shift into the residential and industrial sectors, with some volume also pivoting into Asia. European diesel futures have hit $350 a barrel, and they aren’t the only ones seeing a huge spike.
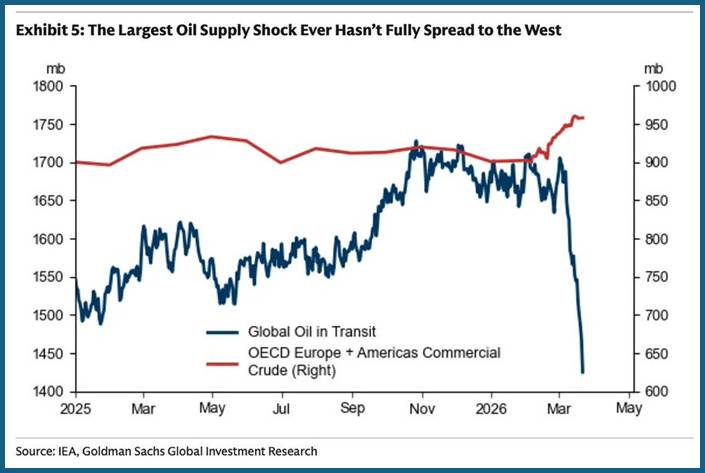
The U.S. is the clear winner on the NGL, Condensate, and LNG front as exports have hit record highs going into the global markets. This is unlikely to stop, but the U.S. will struggle to maintain current diesel production. The availability of Venezuelan crude will help, but the physical price of crude is driving the show here. Crack spreads on gasoline and diesel are highlighting the true pressure around the world. This chart shows the precipitous drop of global oil in transit (blue line).
[Red line = OECD Europe + Americas Commercial Crude (right axis, 0.95B barrels): this tracks commercial crude inventories held by Western buyers.]
Despite the tanker collapse, this line has barely moved—when it finally does, the physical shock will have arrived. This is what I referred to earlier regarding large amounts of OECD storage, but it doesn’t mean it’s universally available. It comes down to the “haves and have nots,” with Japan a clear winner, given their storage. The national average price of diesel has reached $5.52/gal on April 3rd according to GasBuddy and is just 30c/gal away from reaching a new all-time record high—something that appears likely to happen. There are some locations that have already hit records, but we will easily take out the national record within the next week or two.
When we look at inflation, this will be a huge driver over the next few months as it moves from PPI to CPI. Here’s a great example from Gasbuddy:
5 states where average diesel prices are up more than $2/gal in the last month. These costs will continue to trickle down to everyday items consumers buy:
- CA +$2.47/gal
- AZ +$2.41/gal
- NV +$2.36/gal
- NC +$2.10/gal
- FL +$2.07/gal
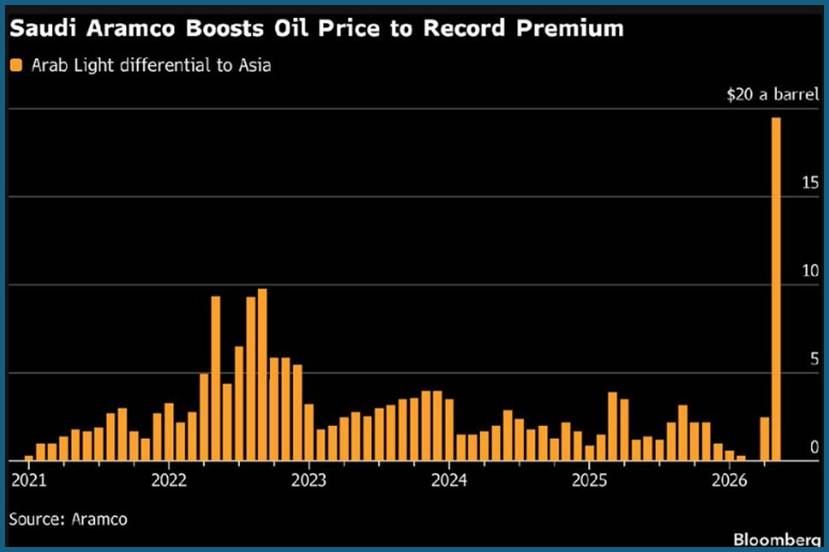
There isn’t a clear replacement for diesel consumption, and it will stretch government budgets that enact price caps or subsidies. If you want to watch the global pain point, diesel is the CLEAR winner. Saudi Arabia just set their OSP (Official Selling Price) for Arab Light to Asia, and it’s a big number. Even as some flows move through the strait, the increase is pricing to this degree hits refiners directly. Their costs explode to produce refined products, and they pass through as many of these increases as possible. Given the broad shortfalls in the global market, it won’t be difficult for refiners to pass through these costs.
Iraq’s SOMO has announced crude cargoes can resume through the strait under an Iranian exemption. This was just announced on April 6th, so it will be interesting to see if these volumes do pass through Hormuz. There is still a lot of uncertainty around volumes, but the biggest impacts remain in Asia.
The U.S. purchases a significant amount of goods from these regions, and this will inherently drive-up costs within the country. As we’ve been saying throughout the report, costs for everything are moving higher, and it will be very sticky.
I’m sure no one is surprised to see a Middle East conflict, but the Iran Regime and their proxies remain the last destabilizing force. The Hezbollah are finally facing pressure from the Lebanese government and military, but the Houthis are a wild card in Yemen. At the moment, they haven’t done anything in the Bab al-Mandab Strait, but this could change if the U.S./Israel increase pressure on Iran. The Bab Strait is being used by Saudi Arabia to get flows into Asia, but any type of missiles/ drones could rapidly change these volumes. There have already been announcements about buses and trucks that run on LPG being shelved due to limited availability of product. The stress caused from the Middle East conflict and Ukraine-Russia war is far from over with each of them compounding the pressure. The unknown will keep physical crude prices at records with way more pressure to come on refined products.
[1] https://www.claimsjournal.com/news/national/2026/03/30/336570.htm