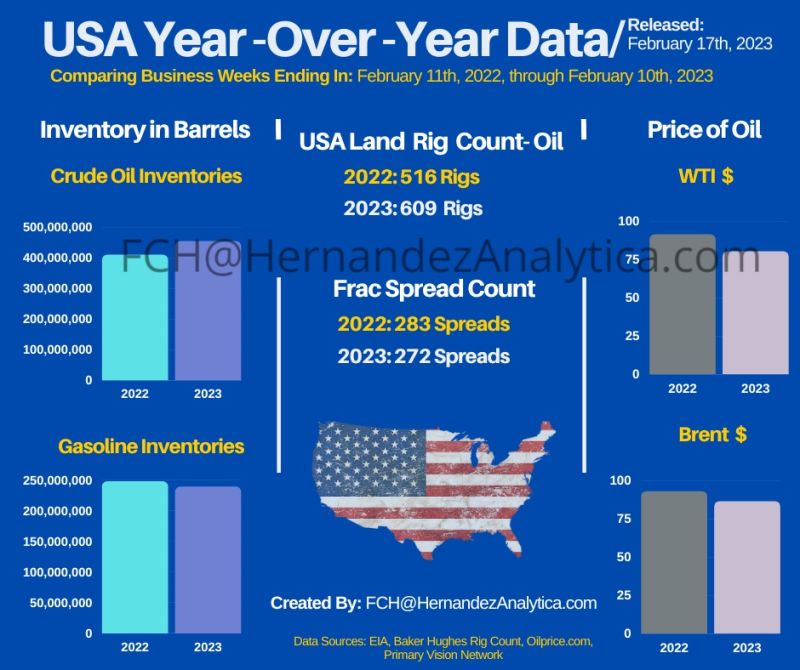
I have captured key industry data, as it relates to the previous business week, via this post's infographic. The below information further complements said #infographic.
(Oil Rig Count: Baker Hughes report)
• February 11th, 2022: 516
• February 10th, 2023: 609
(Primary Vision Network - Frac Spread Count)
• February 11th, 2022: 283
• February 10th, 2023: 272
(Oilprice site: #WTI price:)
• February 11th, 2022: 91.35 USD
• February 10th, 2023: 79.72 USD
(OilPrice site: Brent Crude price)
• February 11th, 2022: 92.84 USD
• February 10th, 2023: 86.39 USD
(EIA Crude Oil Inventories – Agency reports on varying days)
• February 4th, 2022: 410,387,000 Barrels
• February 3rd, 2023: 455,111,000 Barrels
(EIA Gasoline Inventories – Agency reports on varying days)
• February 4th, 2022: 248,393,000 Barrels
• February 3rd, 2023: 239,606,000 Barrels
