
The phrase "demand destruction" is getting heavy rotation right now. It appears in analyst notes, energy Twitter threads, and IEA commentary with a frequency that suggests the concept is self-evident and permanent. It is neither. A careful look at the historical record reveals that sustained, structural declines in global oil demand have occurred exactly twice in the modern era, and both required conditions so extreme that they belong in a category entirely separate from the pricing cycles the market routinely confuses with fundamental demand shifts.
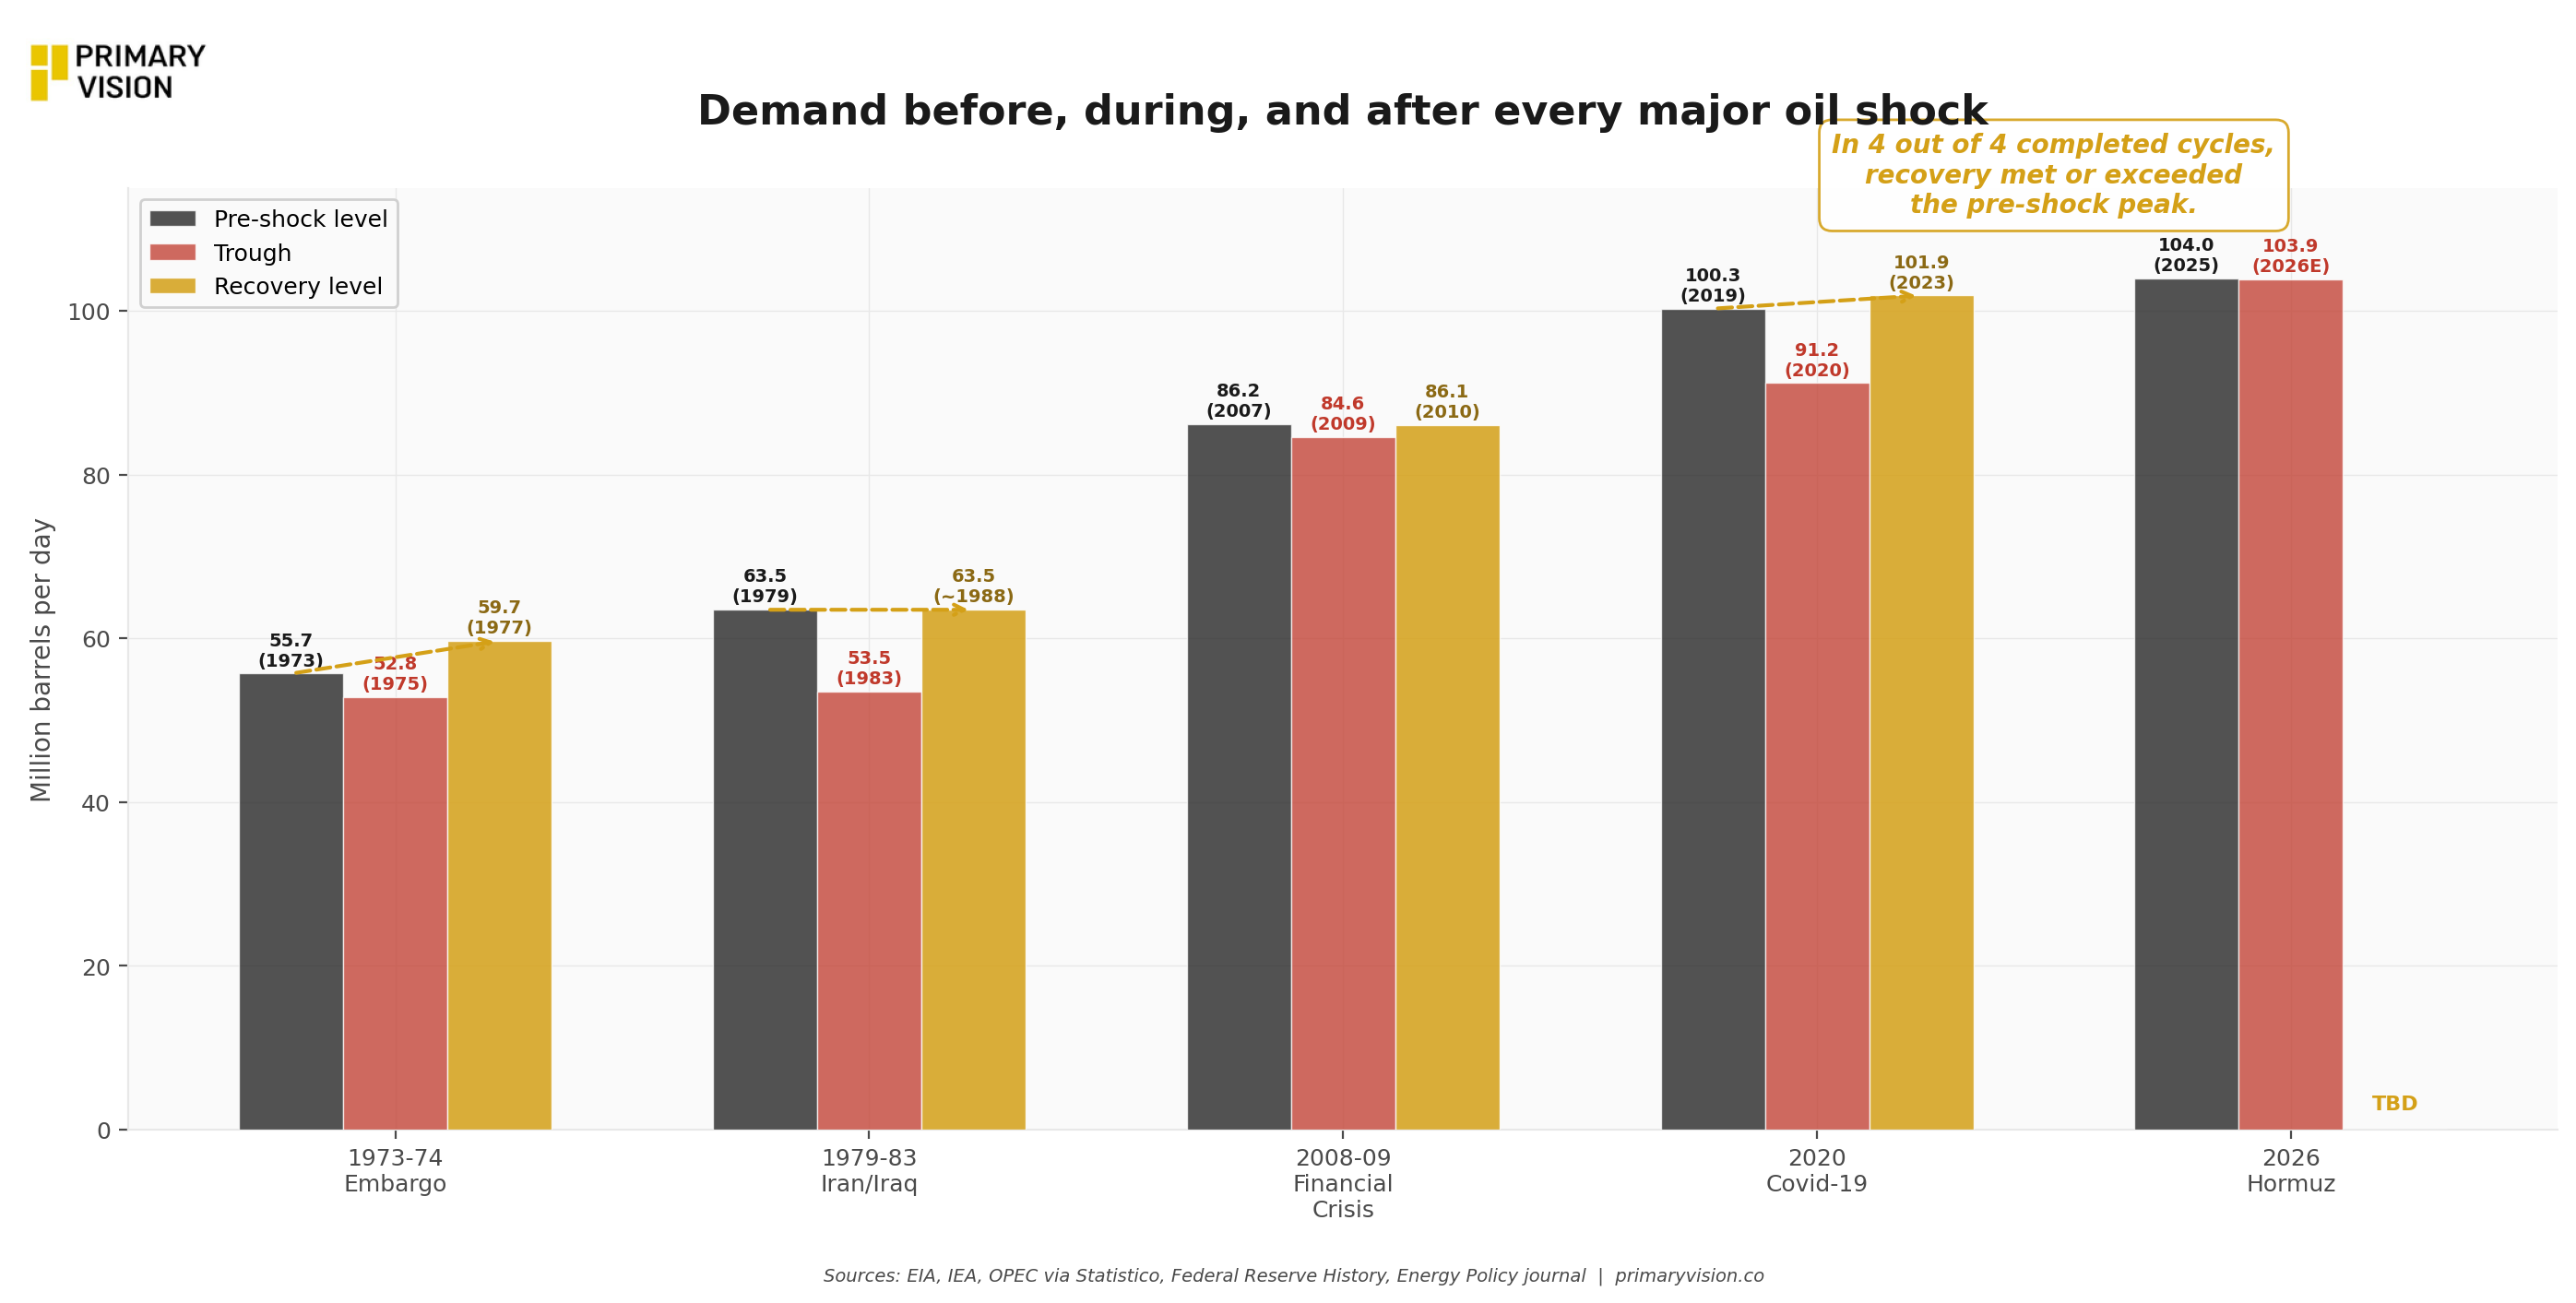
Start with the data. The Arab oil embargo of 1973-74 quadrupled the nominal price of crude within months and triggered recessions across the industrialized world. GDP fell 4.7% in the United States, 2.5% in Europe, and 7% in Japan. And yet global oil demand did not collapse. EIA historical production data show world output at 55.7 million barrels per day in 1973, dipping to 52.8 million in 1975, then recovering to 57.3 million by 1976 and climbing to 59.7 million by 1977, well past the pre-embargo level. The price shock slowed the rate of demand growth for barely a year. Consumers adjusted at the margins, governments launched conservation campaigns, and automakers began building smaller cars. But the world kept burning more oil every year.
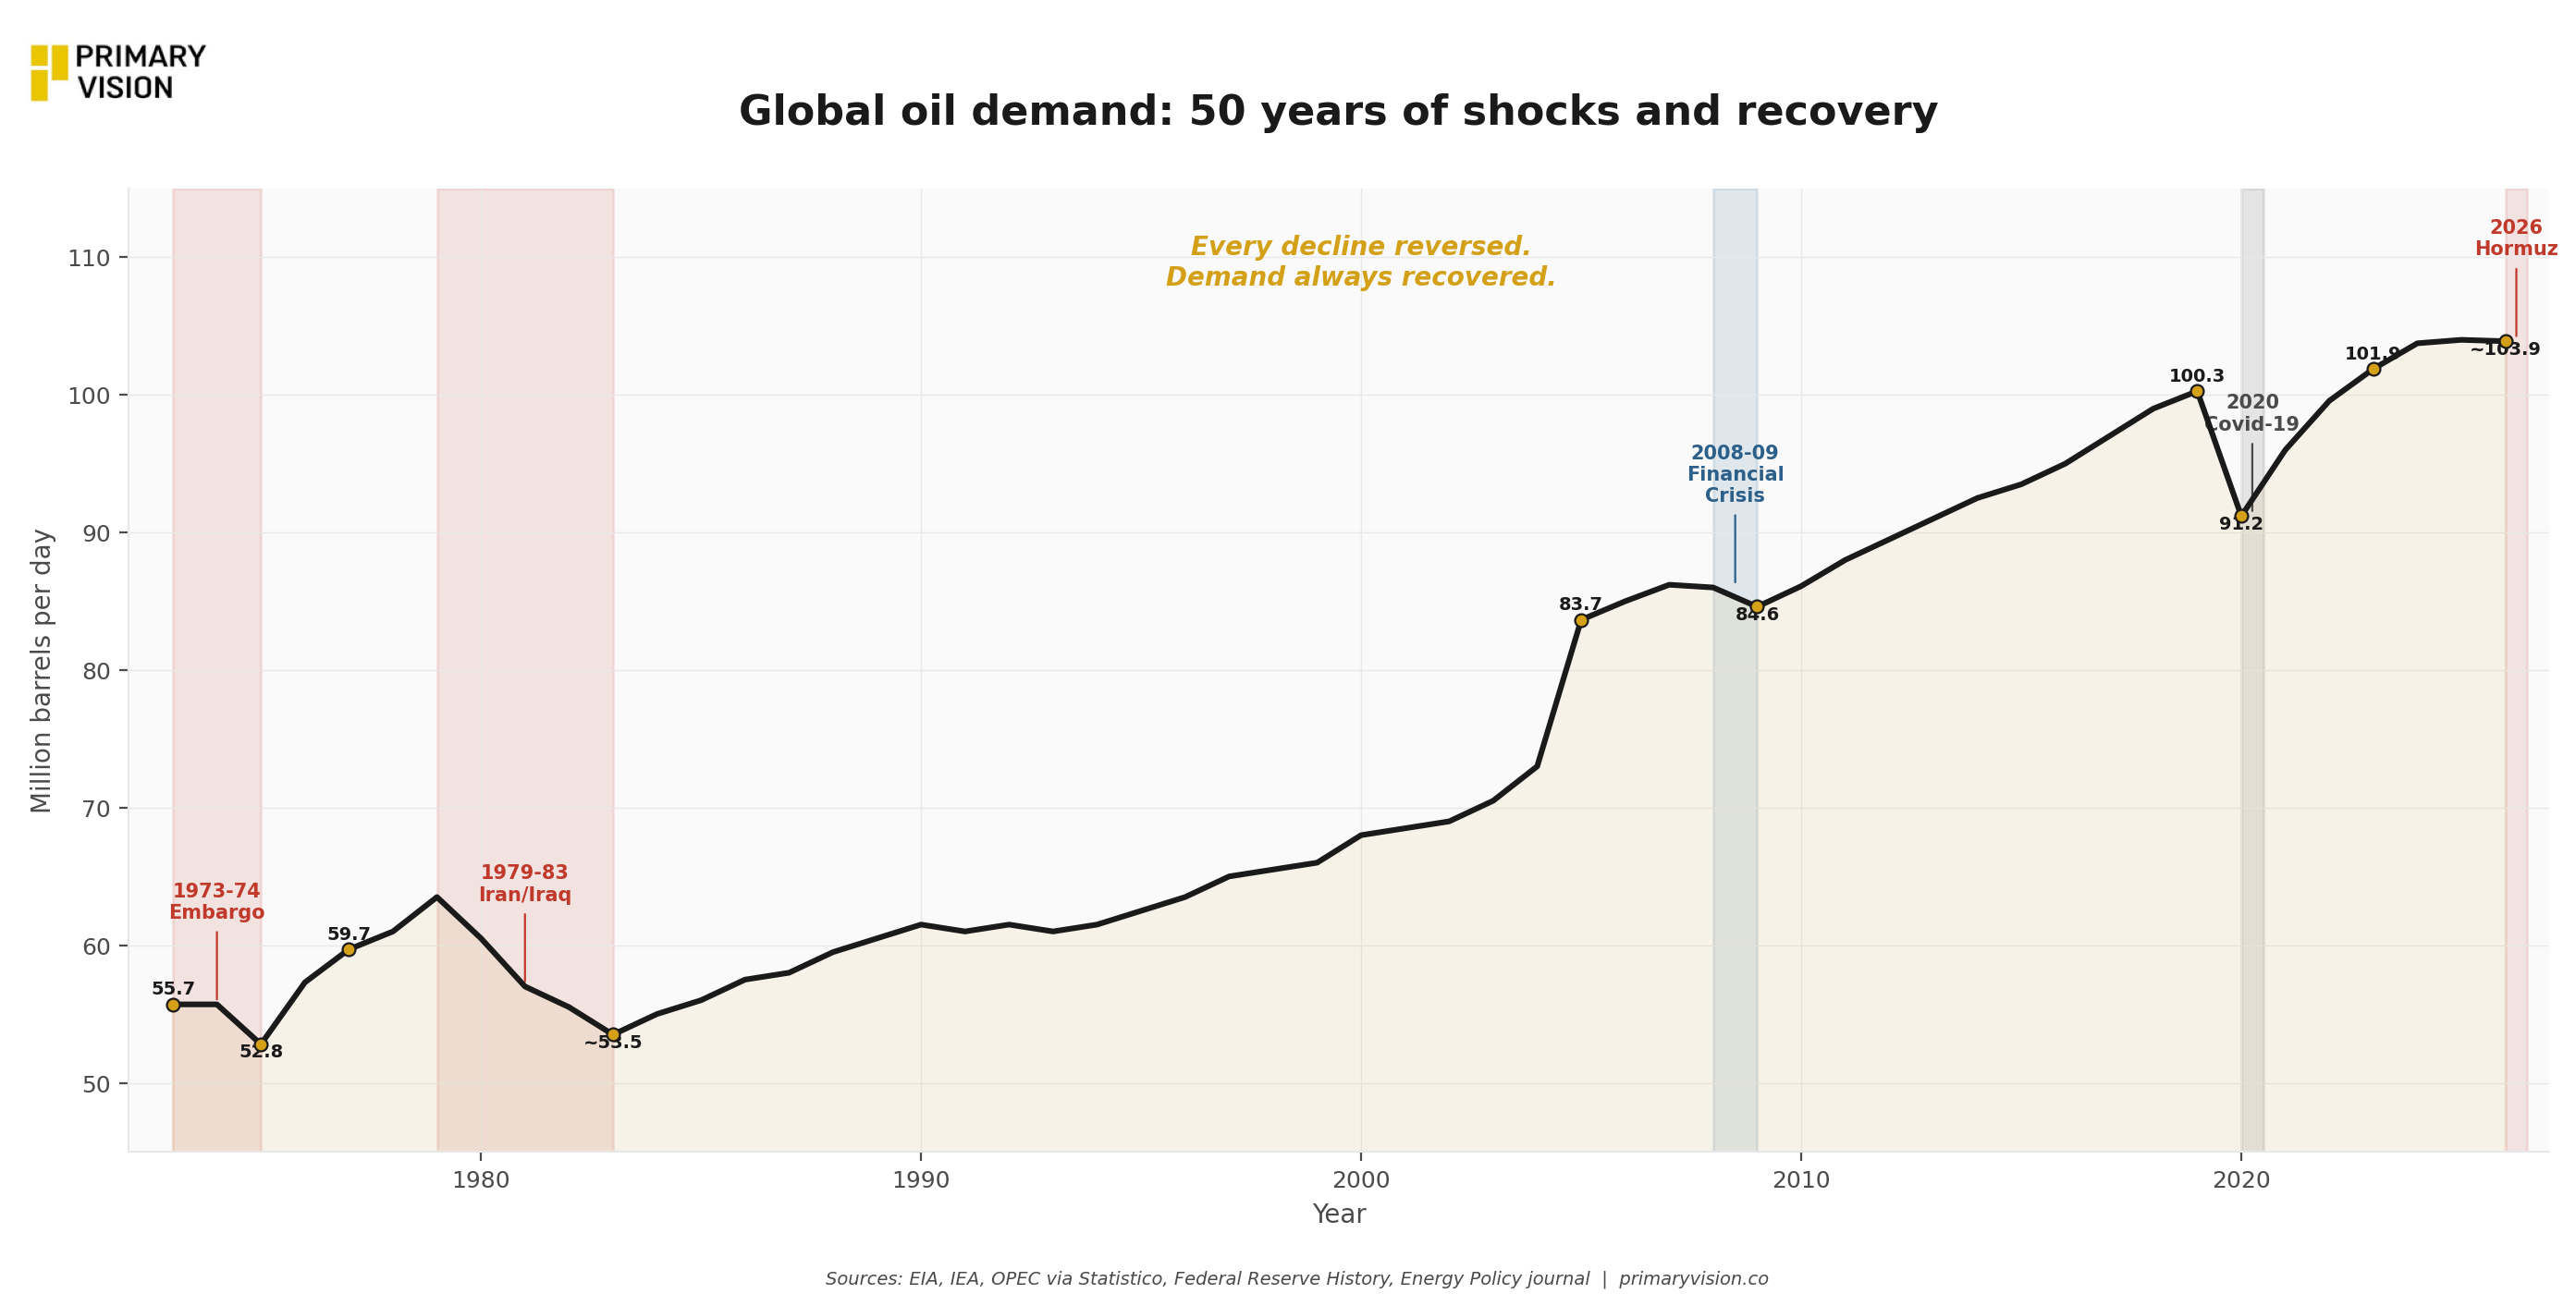
The 1979 shock was more severe. Iranian output dropped by 4.8 million barrels per day, prices more than doubled within twelve months, and the subsequent Iran-Iraq War compounded the disruption. This time, demand did decline meaningfully. According to research published in Energy Policy, the price increase from 1979 to 1981 was eventually completely reversed, but not before triggering a multi-year contraction in consumption. The mechanism was not price alone. It was a combination of deep recession across the OECD, a massive structural shift from oil to natural gas and nuclear power in electricity generation, and government-mandated efficiency standards that altered the vehicle fleet over a decade. The Chicago Fed noted that higher prices caused consumers to initially reduce demand, but over time economies adjusted and consumption recovered as substitution effects faded. The Baker Institute observed that oil demand growth slowed from 7-8% per year during the 1960s and 1970s to 1.5-2% thereafter, but it did not stop. The lesson from the 1970s is that demand proved astonishingly resilient even when prices rose by multiples, and the only period of sustained decline required a decade of coordinated policy intervention on top of the price signal.
The 2003 to 2008 run tells the story even more clearly. Oil prices rose nearly fivefold over five years, from roughly $31 to $145 per barrel in real terms. Global demand did not flinch. OPEC data compiled by Statistico show global consumption rising from 83.65 million barrels per day in 2005 to over 86 million by 2007, growing straight through the price surge. The IEA pegged 2004 demand at 82.4 million barrels per day and was already revising upward. Demand only broke when the global financial crisis triggered the worst economic contraction since the 1930s, dropping consumption to 84.60 million barrels per day in 2009. By October of that year the IEA was already revising 2010 forecasts upward to 86.1 million barrels per day as recovery took hold. Then came 2020. Global consumption fell to 91.19 million barrels per day, down from 100.27 million in 2019, a drop driven entirely by governments ordering populations to stay indoors during a pandemic. By 2023, demand had surged back to 101.89 million barrels per day.
So where does 2026 fit? Honestly, it fits where the data says it fits, and right now the data is alarming. The IEA's April report projects global oil demand contracting by 80,000 barrels per day for the full year, with a 2.3 million barrel per day year-on-year decline in April alone, the sharpest monthly drop since the early months of Covid. The EIA's latest outlook has cut its 2026 demand growth forecast from 1.2 million to 600,000 barrels per day. Asian countries are rationing fuel and implementing four-day work weeks. European airlines are canceling flights over jet fuel costs. The demand destruction happening today is real, and pretending otherwise would be dishonest.
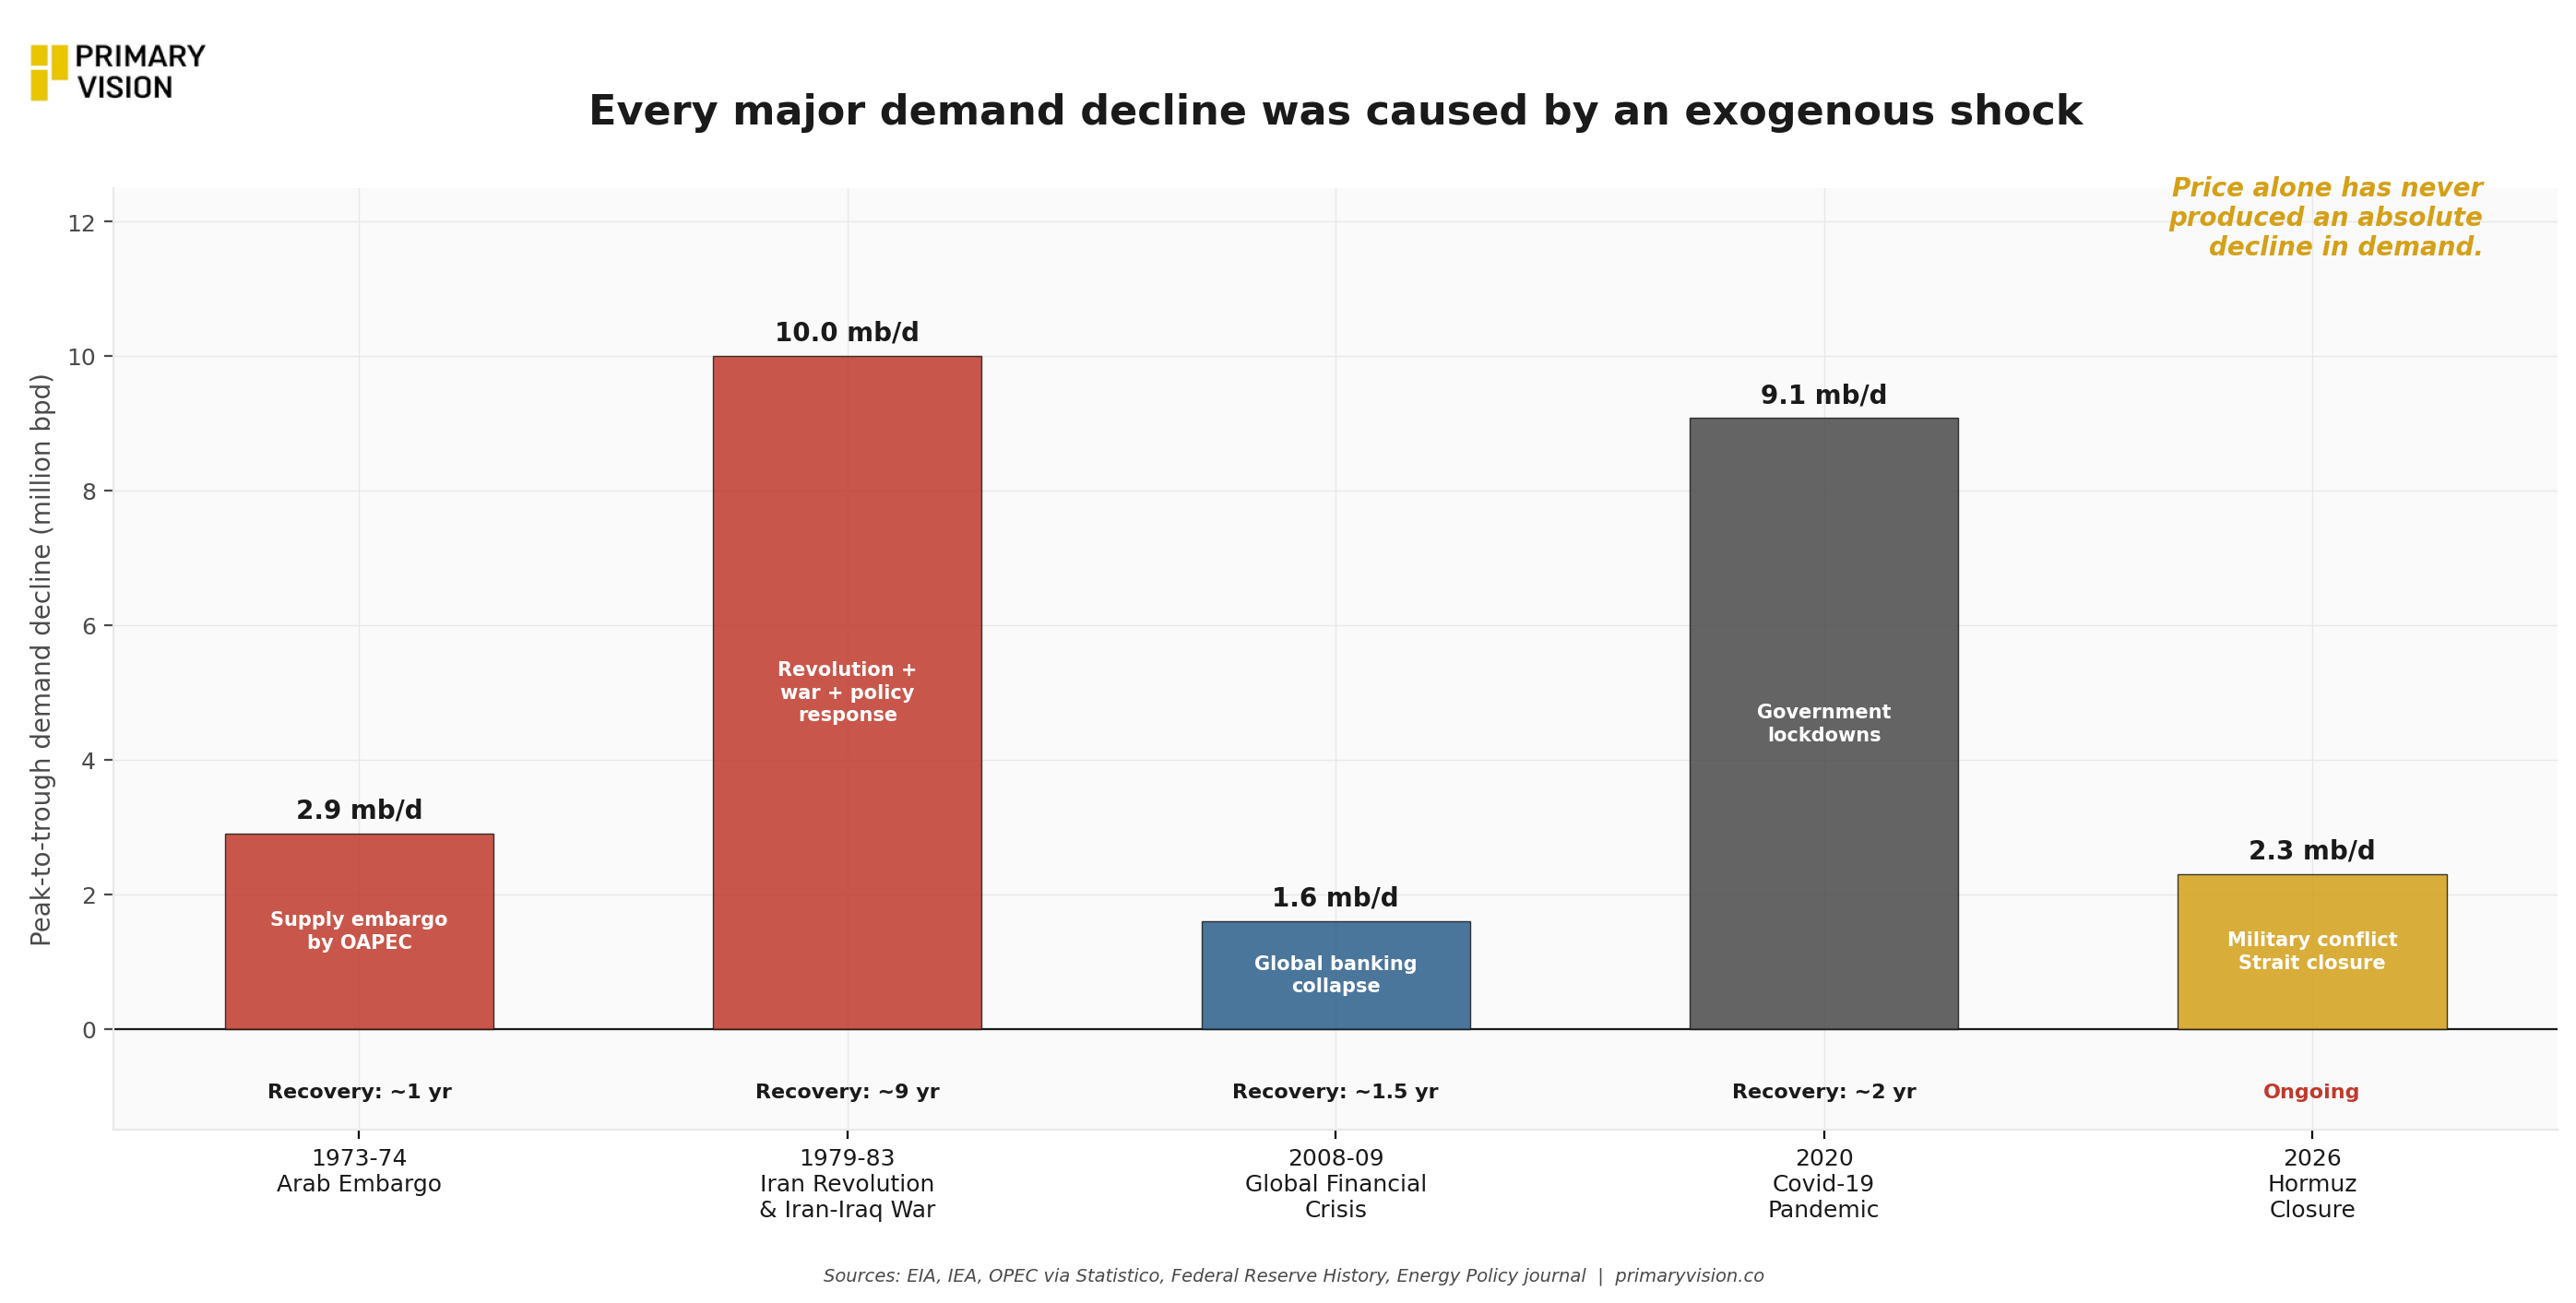
But recognizing the destruction and understanding its nature are different exercises. What the historical record makes unambiguously clear is that every episode of meaningful demand decline was caused by an exogenous shock, whether embargo, financial crisis, pandemic, or war, and every single one reversed once the shock subsided. The EIA itself projects demand rebounding by 1.6 million barrels per day in 2027 once Hormuz flows normalize. The narrative that demand is entering a secular decline driven by high prices alone has no support in 50 years of data. Prices can slow demand growth. Prices can shift demand across fuels and sectors. But only catastrophic disruptions to the physical or economic infrastructure of global commerce have ever produced absolute declines, and those declines have always been temporary.
The question for this cycle is not whether demand will recover. It will. The question is how long the Strait of Hormuz remains effectively closed, how deep the inventory drawdown goes before resolution, and whether the supply-side damage to Middle Eastern infrastructure extends the timeline beyond what markets are currently pricing. Those are serious uncertainties. Confusing them with a structural demand story is not.