Market Sentiment Tracker: Are We Living a 1970s Plot in a 2025 Market?
By
Osama
on October 21, 2025
in
Market Sentiment
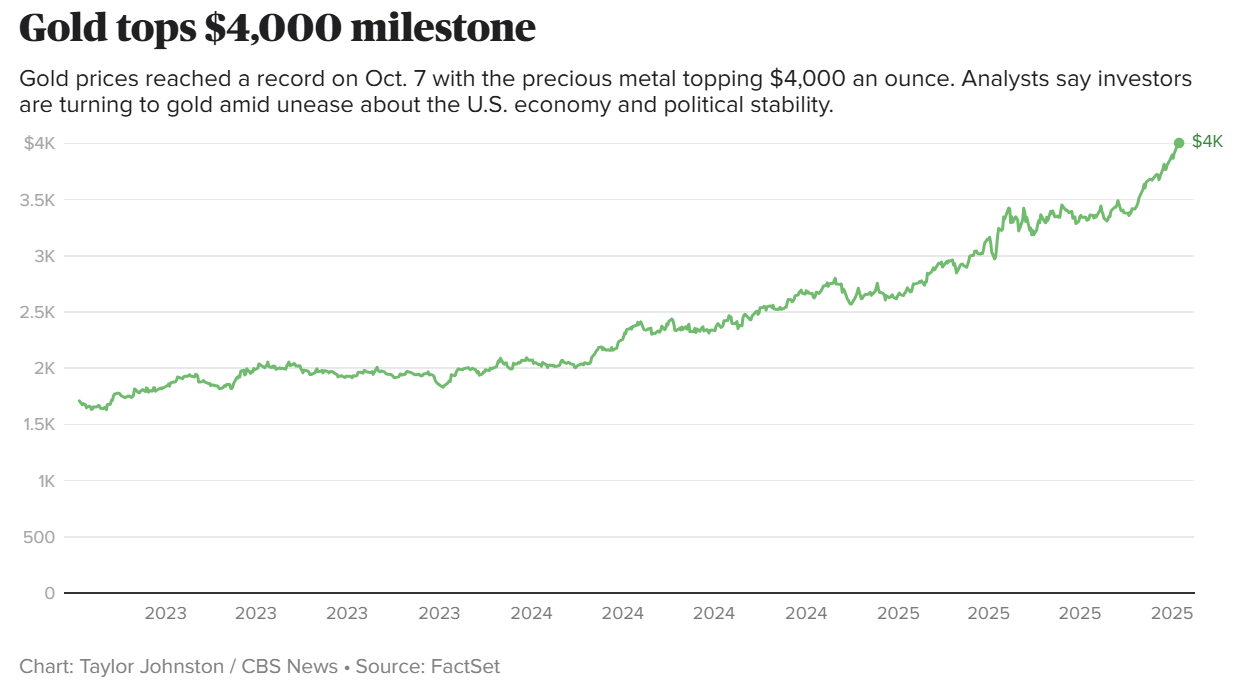
Lately, I’ve been watching the markets and struggling to make sense of what I’m seeing. On one hand, everything seems to be breaking records. The S&P 500 keeps pushing to new highs, powered by the same megacap giants that have dominated for years. Gold has surged past $4,000 an ounce an all-time record while silver has followed suit, touching levels not seen before. Even Pakistan’s KSE-100 index, often overlooked in global conversations, is trading at its highest point in history.
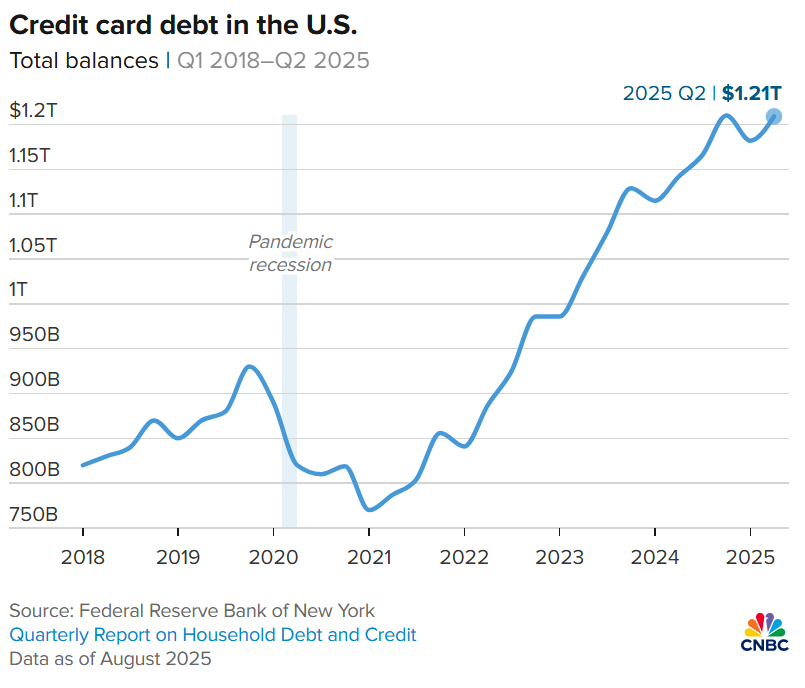
Everywhere I look, risk assets and hard assets alike are defying gravity. And yet, beneath all that, the macro data tells a very different story: U.S. credit card debt has climbed past $1.2 trillion, job growth is slowing, wages have stalled both in America and across Europe, and household balance sheets are tightening. None of this adds up. The traditional textbook relationships the ones that should connect growth, inflation, wages, and markets seem to have broken down completely.
The economy behind it all looks tired. U.S. payrolls barely rose in August just 22,000 jobs and the unemployment rate sits at 4.3%. Participation is drifting lower, and long-term joblessness has crept up. Wages are softening too: both the Atlanta Fed and Indeed’s trackers show pay growth slowing through mid-2025. In Europe, the ECB’s own wage measure is cooling toward the 2–3% range, which points to less pay pressure even though prices are still above pre-COVID norms. Households are stretched. U.S. credit card debt just crossed $1.2 trillion, part of a record $18 trillion in total household liabilities. Financial markets look late-cycle euphoric; real people don’t.
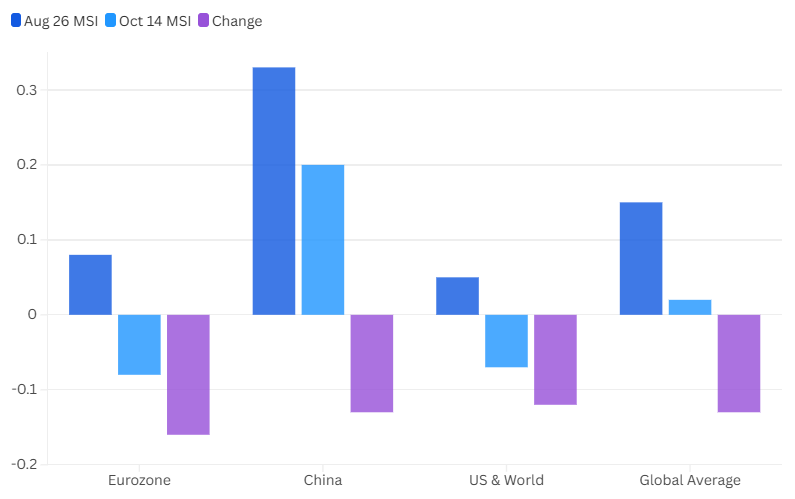
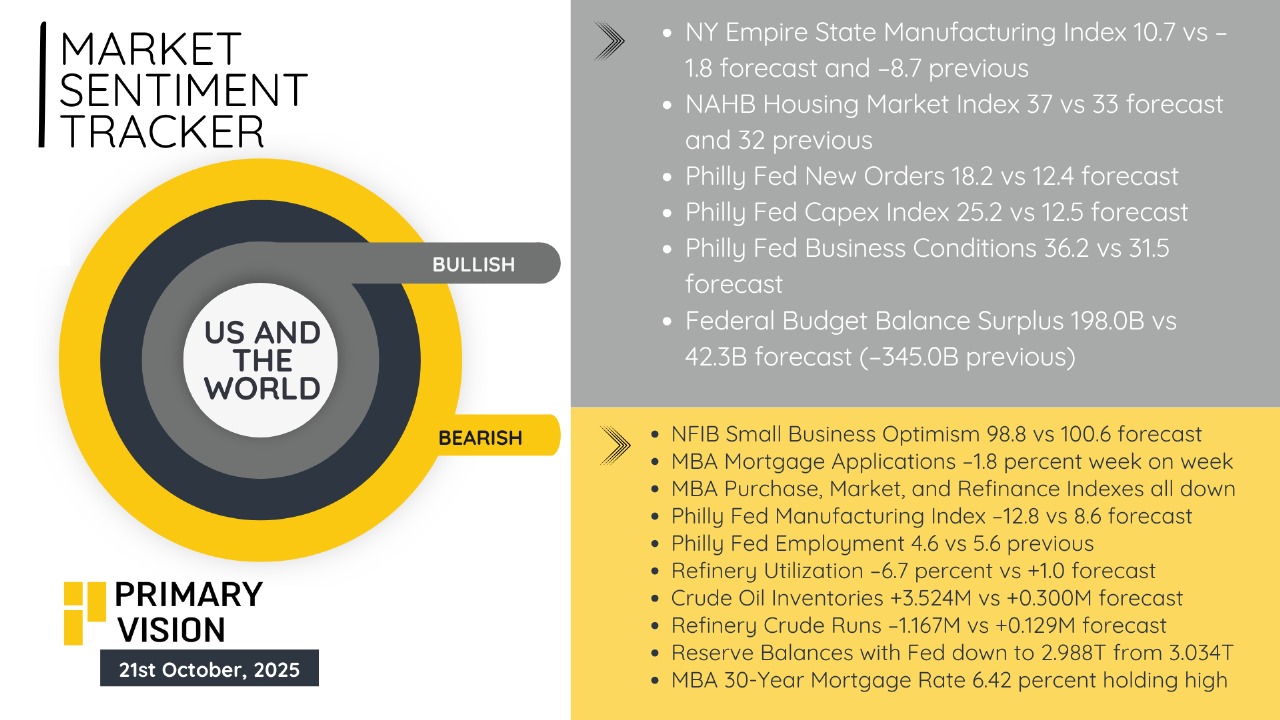
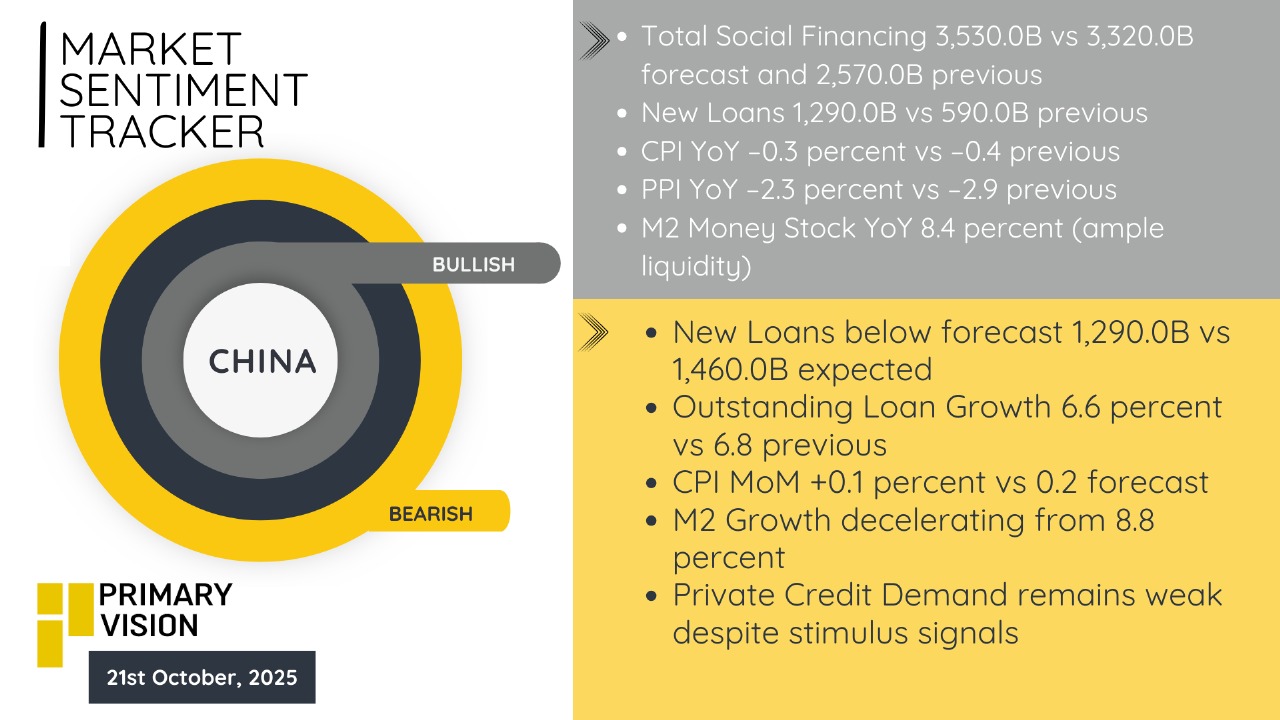
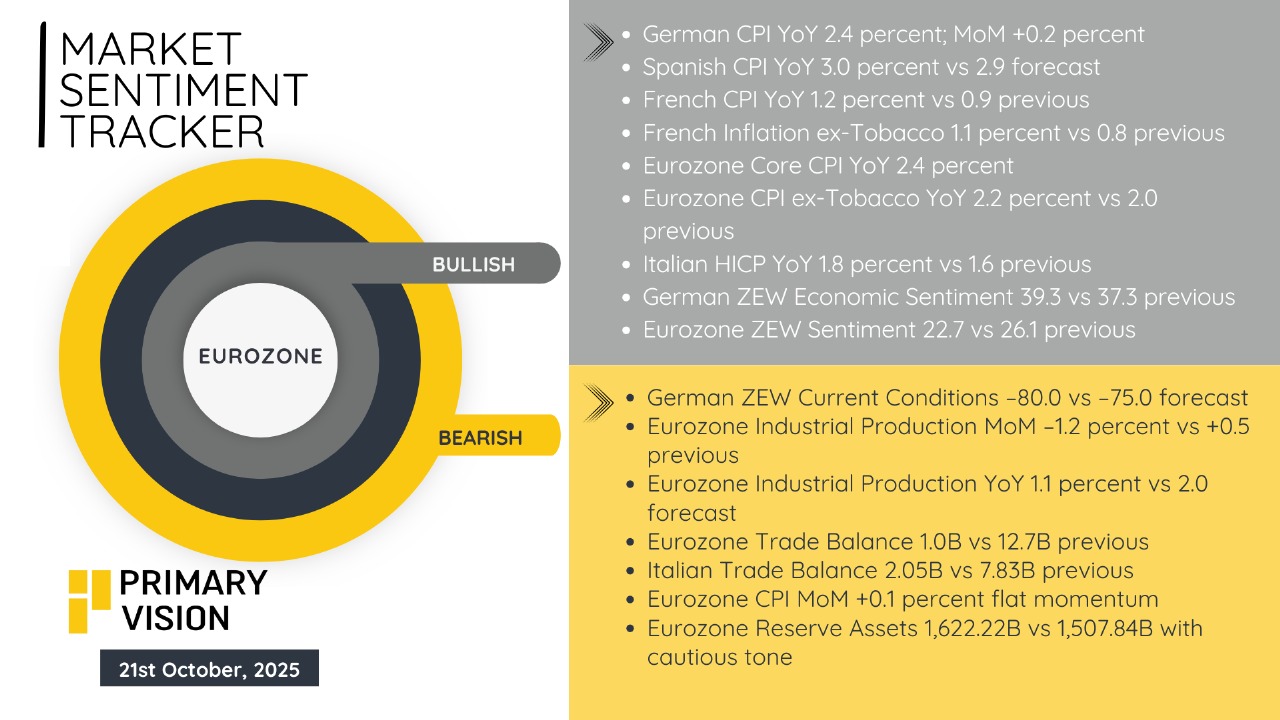
We’ve been tracking this divergence for a while in our Market Sentiment Tracker (MST). I did some calculations and came up with a Market Sentiment Index (MSI) that shows air is coming out of global sentiment. The Eurozone slipped from +0.08 to –0.08 (–0.16) and has turned slightly bearish. China eased from +0.33 to +0.20 (–0.13) but is still in positive territory. The U.S. and world composite moved from +0.05 to –0.07 (–0.12), and the global average fell from +0.15 to +0.02 (–0.13). In plain English, optimism is fading almost everywhere. The change lines up with the IMF and World Bank’s latest revisions, both flagging softer trade, weaker manufacturing, and less policy support heading into year-end.
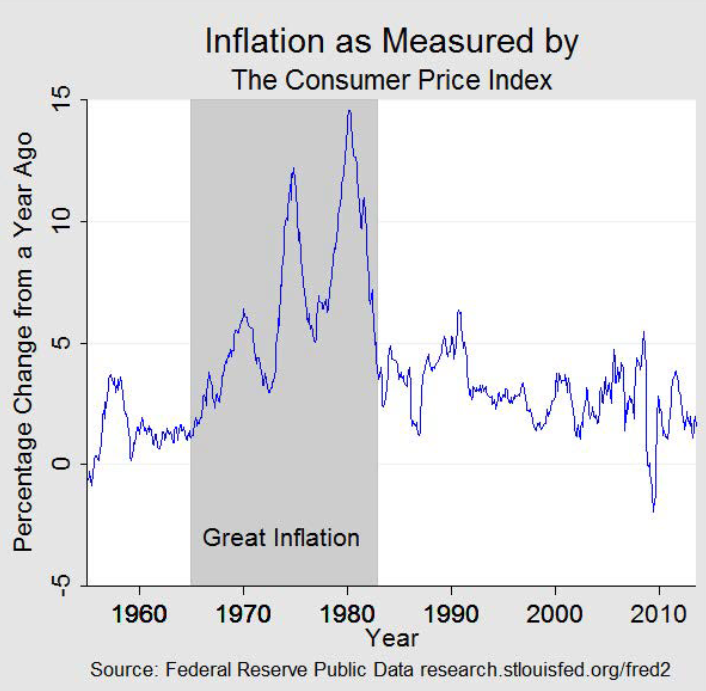
There is precedent for a similar disconnect, and you can find it by leafing back to the 1970s. The “Great Inflation” was born from policy choices and energy shocks that destabilized the Phillips curve, producing the once-heretical combination of high inflation and weak growth. The oil shocks of 1973–74 and 1978–79 transmitted cost-push pressures and stoked inflation expectations, while policy reacted in fits and starts until the Volcker regime broke the fever at great real-economy cost. What matters for today is the pattern: volatile growth, shifting inflation regimes, and periodic rallies in hard assets as households and institutions searched for stores of value.
The “broken textbook” relationships you notice—rising asset prices alongside slowing job growth and flatlining real wages—reflect a market narrative dominated by two forces. One is AI-led profitability and capex that keeps the top of the U.S. equity market levitating, even as breadth wobbles and cyclicals sag. I will be talking about this more in the next article. For now, here are our latest snapshots of MSTs coming out of U.S., China and Eurozone.
Upgrade to Pro Today and get…
• This article — plus dozens more each month, all within our full Research Module
• Frac Hits — our National-Level Frac Spread Count and Frac Job Count, updated weekly
• Frac Operator Monitor — detailed FSC & FJC by operator
• And so much more, designed to help you track, forecast, and outperform