






Articles
- BLOG / Articles / View
- Articles
Monday Macro View (Special Report): Did U.S. Shale Really Fail to Respond to the 2026 Oil Shock?
By Osama on September 21, 2026 in Market Sentiment
A few days ago, I came across CEPR’s recent analysis examining what the Iran war tells us about the price responsiveness of U.S. shale. The conclusion was interesting: despite the sharp increase in crude prices, U.S. shale production barely moved during the first month and showed little response over the March-to-May quarter. On that basis, the article argue that short-run shale oil supply elasticity was effectively zero.
The finding itself is not particularly difficult to understand. Wells take time to drill, complete and bring online, while even drilled but uncompleted wells cannot suddenly become producing wells within a few days. Where the article made me think, however, was about something slightly different: are production numbers necessarily the best place to look for the beginning of shale’s response to higher prices?
At Primary Vision, we have been watching the same episode from further upstream in the process by tracking frac spreads and frac jobs. Those numbers do not tell us how many additional barrels were produced immediately, nor should they be treated as an alternative measure of production elasticity. What they can tell us is whether the machinery responsible for producing those future barrels was beginning to behave differently. And in 2026, it was.
When the Iran conflict escalated at the end of February, Primary Vision’s Frac Spread Count stood at 167. The initial response was muted, which was hardly surprising. Operators had seen plenty of geopolitical price spikes disappear before there was any reason to alter drilling or completion plans. As crude remained elevated, though, the picture gradually changed. FSC reached 192 by the end of May, approximately 15% above its late-February level, and climbed further to 205 in early July. From the point immediately before the shock to that summer peak, active frac spreads increased by roughly 23%.
This move is important to understand because May sits inside the same general period in which the production response looked extremely weak. Production had not suddenly accelerated, yet the equipment involved in bringing future wells online was already becoming more active.
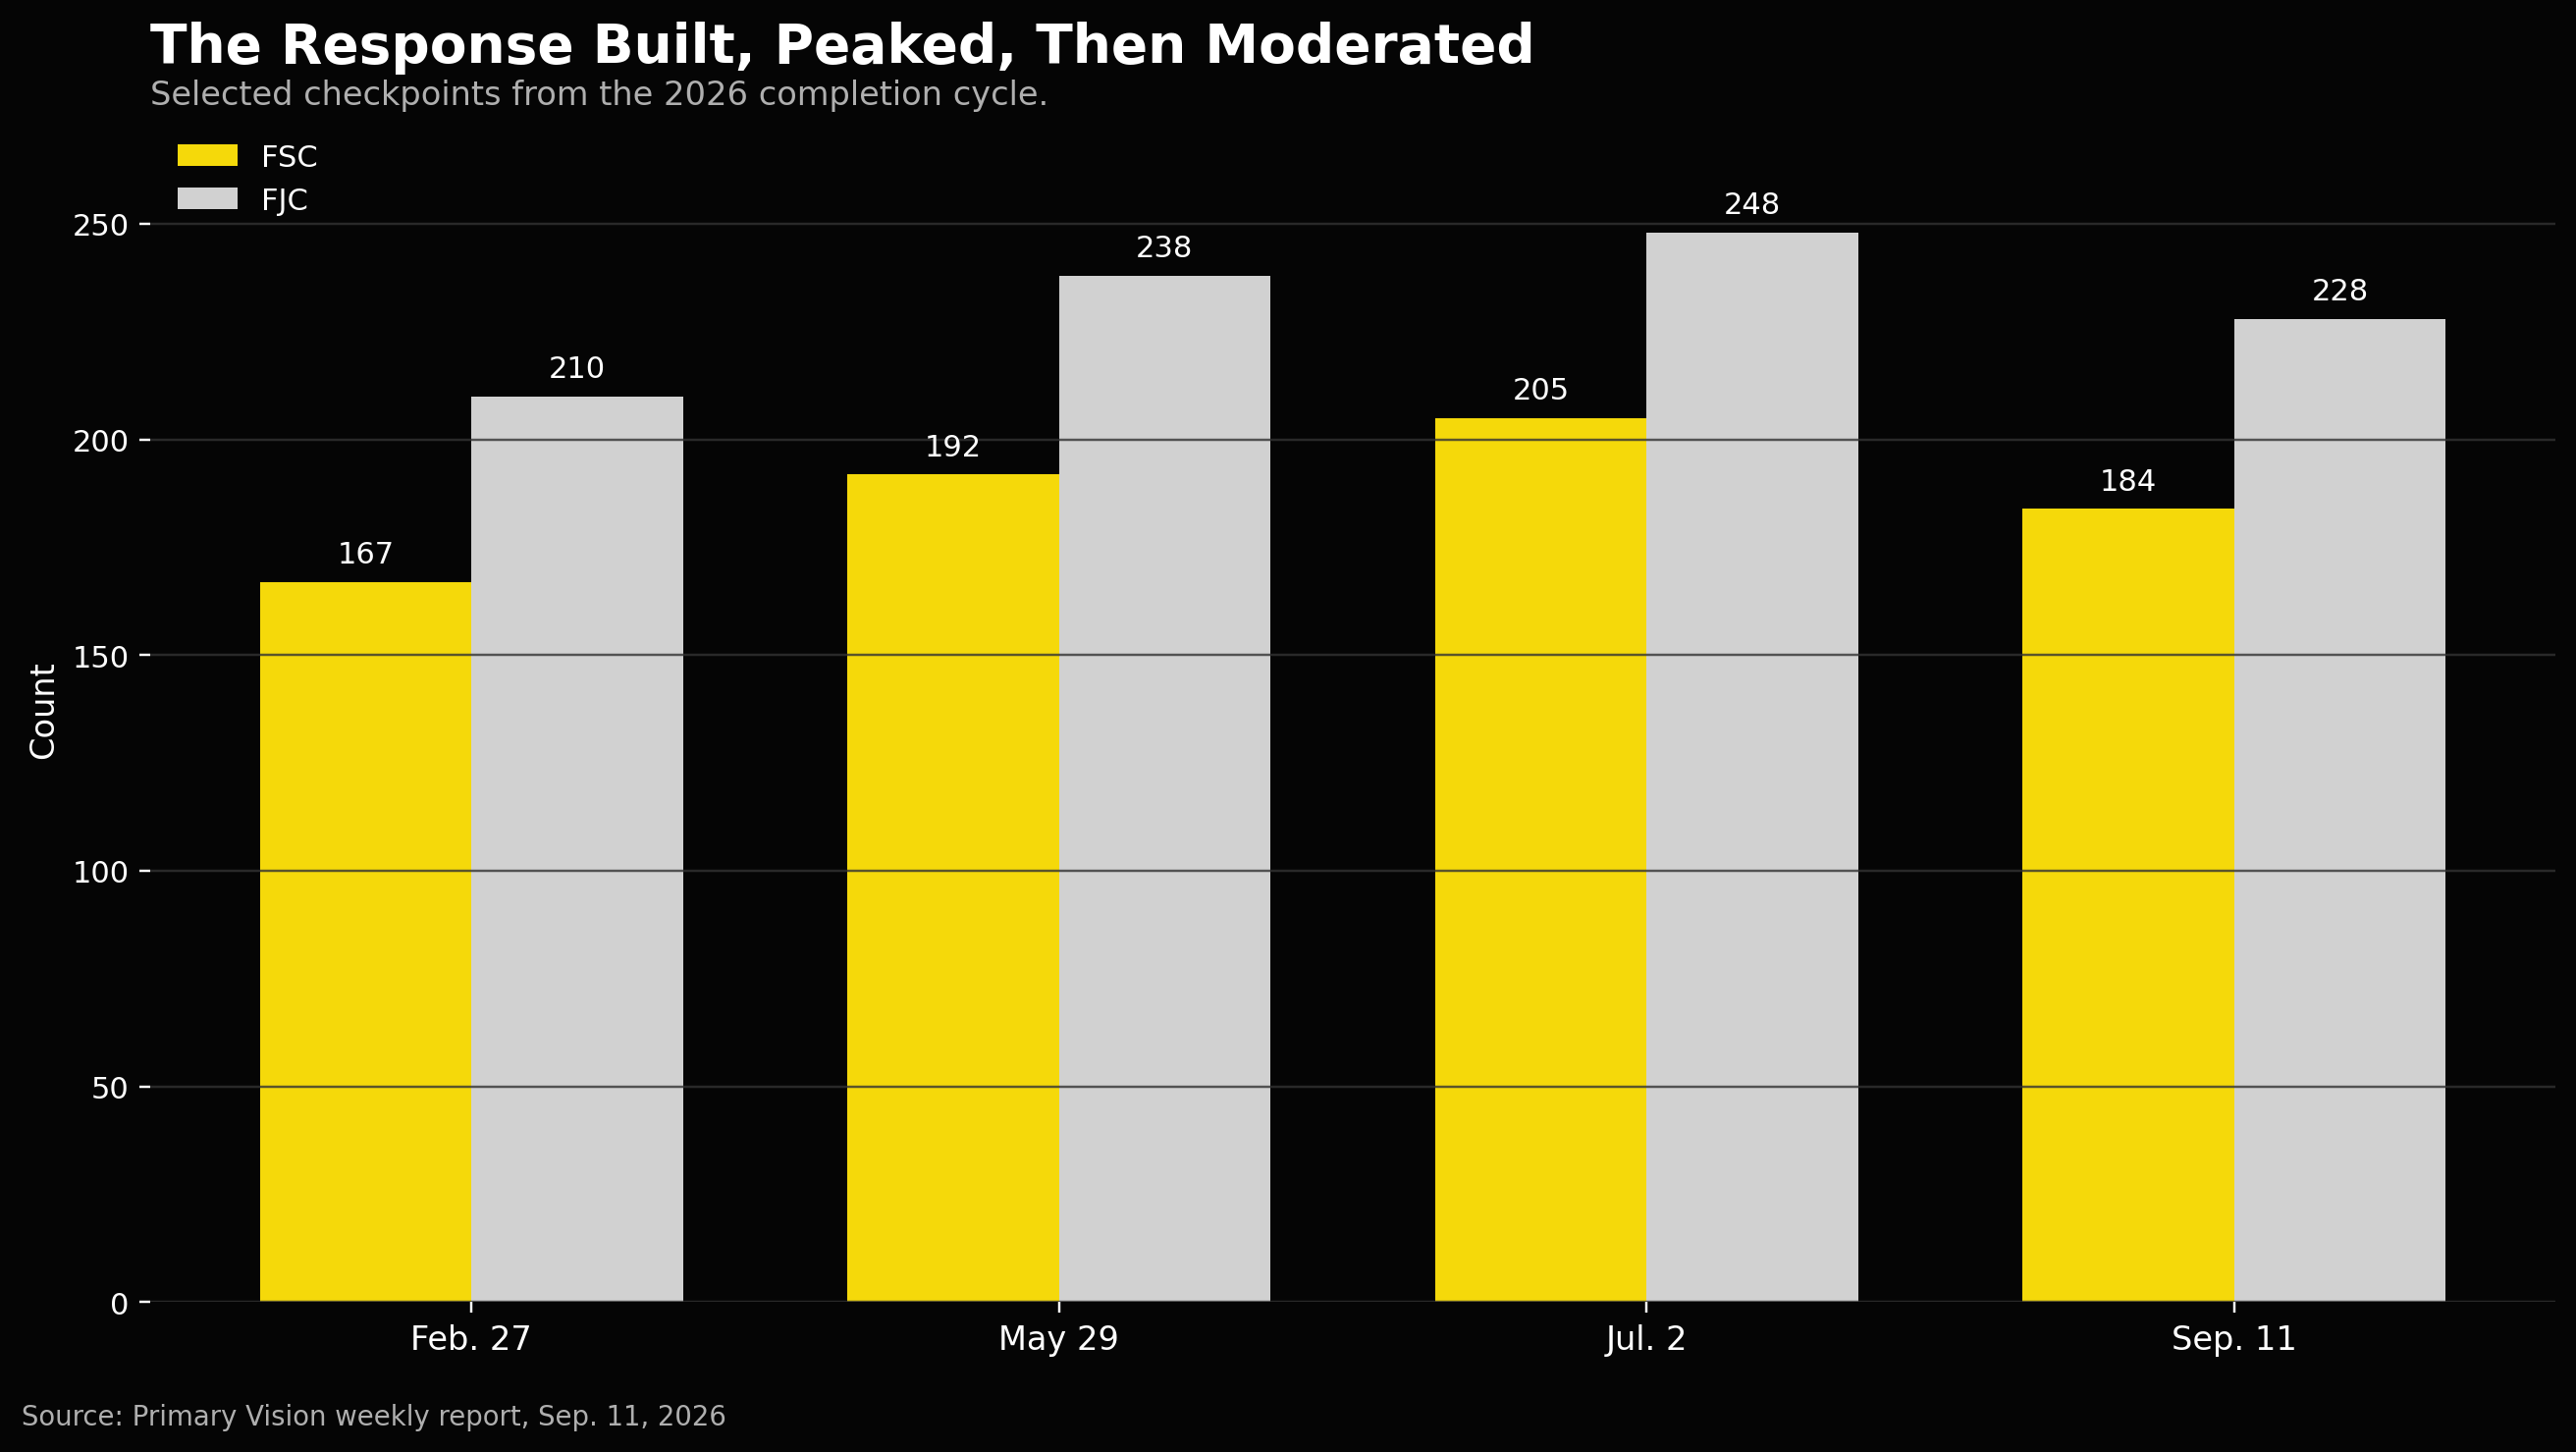
The Frac Job Count offers another view of the same adjustment. FJC increased from around 210 at the end of February to 238 by the end of May before reaching 248 in early July. In other words, the number of jobs being performed was increasing alongside the number of active spreads.
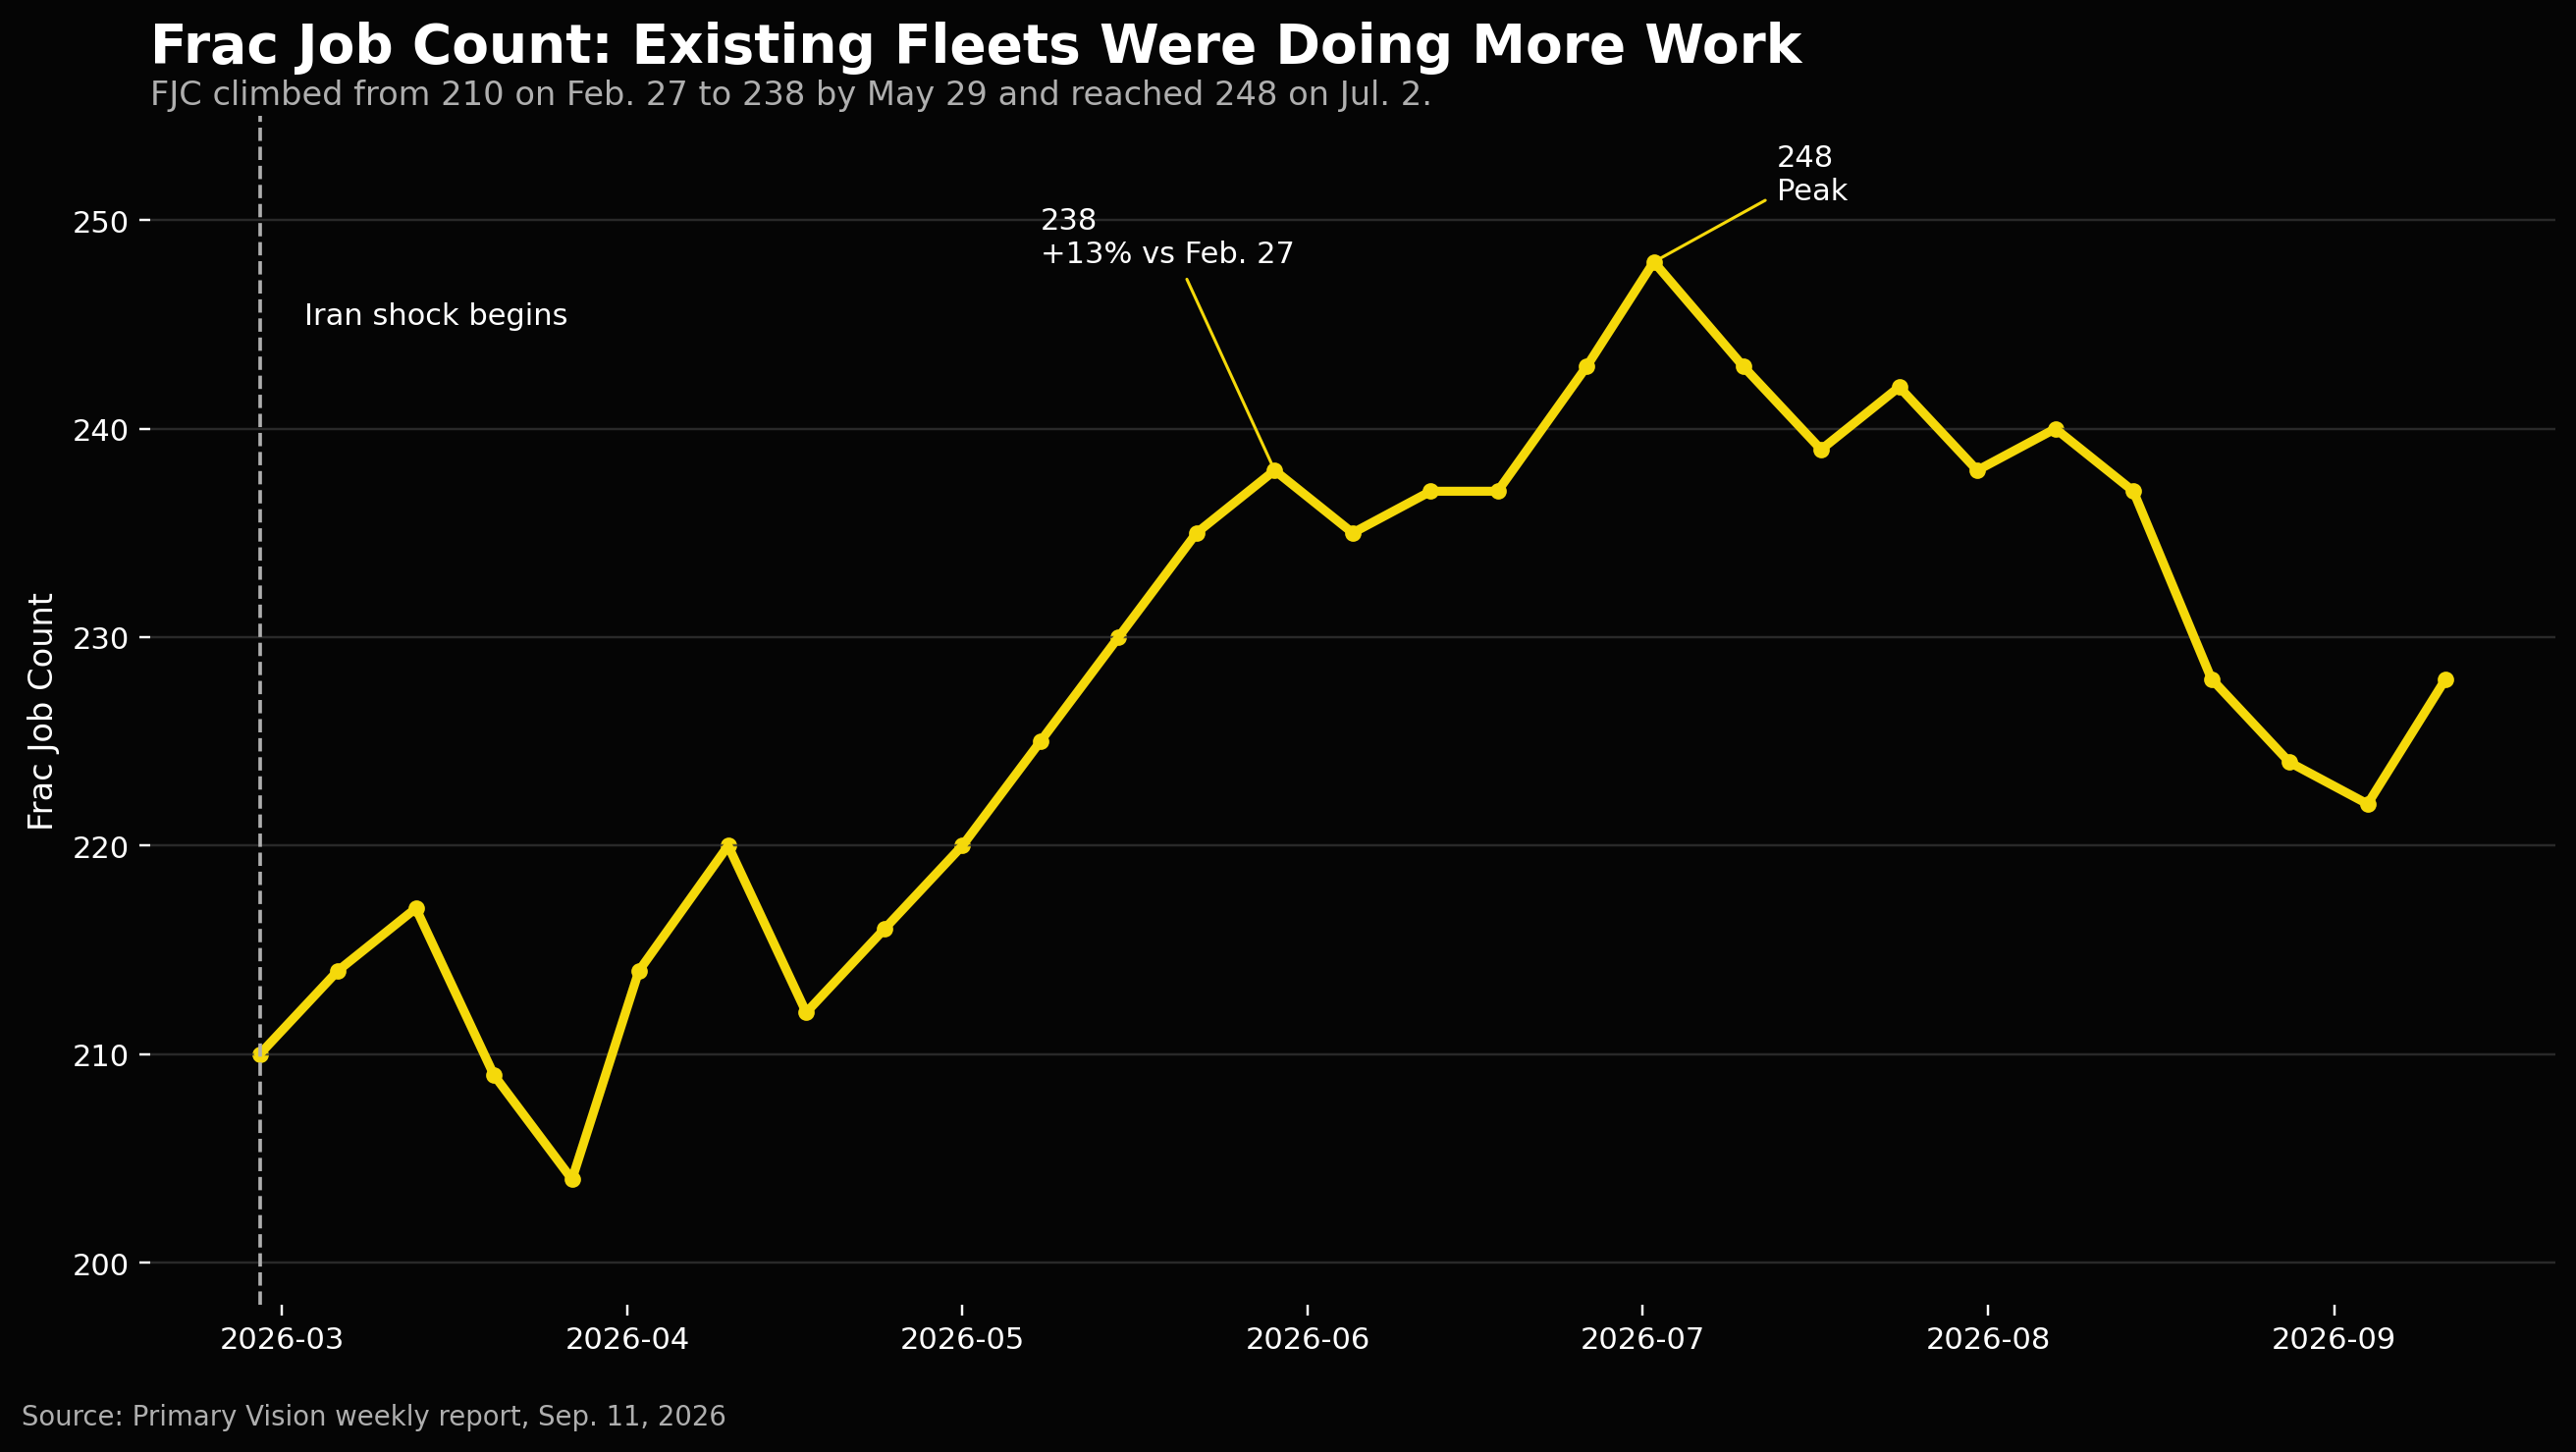
This is where the distinction between production elasticity and operational responsiveness becomes useful. An operator does not need to respond to higher prices by immediately adding dozens of rigs or deploying a completely new block of frac fleets. Existing programmes can be accelerated, schedules can be rearranged, idle periods between jobs can be reduced and equipment already operating in the field can simply perform more work.
The pathway from oil price to oil production therefore looks less like a single reaction and more like a sequence:
Price → economics → capital decisions → completion schedules → frac activity → completed wells → production.
If we compare only the first and last parts of that chain over a very short period, the response can look close to zero even while something meaningful is happening in between.
Primary Vision’s historical data suggests duration is particularly important. When Russia invaded Ukraine in 2022 and oil remained above $100 for several months, frac activity subsequently increased. The October 2023 price spike following the Israel-Hamas conflict was different: prices moved sharply but quickly faded, and completion activity never developed into a sustained expansion. The 2024 rally toward $85 also produced little response as operators remained disciplined with capital. That was why our argument at the beginning of the Iran conflict was never simply that higher oil prices would lead to more drilling. The question was whether prices would remain high for long enough to alter operator behaviour.
By spring, some operators were beginning to make those changes. Continental Resources moved toward higher spending and production plans, while Diamondback and EOG were among the independents later discussing higher activity. U.S. independents responded more quickly than the supermajors, which remained reluctant to redesign longer-term programmes around what they still considered a geopolitical disruption. That difference is also important because a national production number inevitably blends companies following very different strategies.
Our operator-level work on Continental, Diamondback and EOG illustrates that point. Their activity profiles are not identical because their acreage, inventory, capital programmes and operating strategies are not identical. Looking beneath the national number therefore becomes increasingly important when trying to understand whether the industry is actually changing direction.
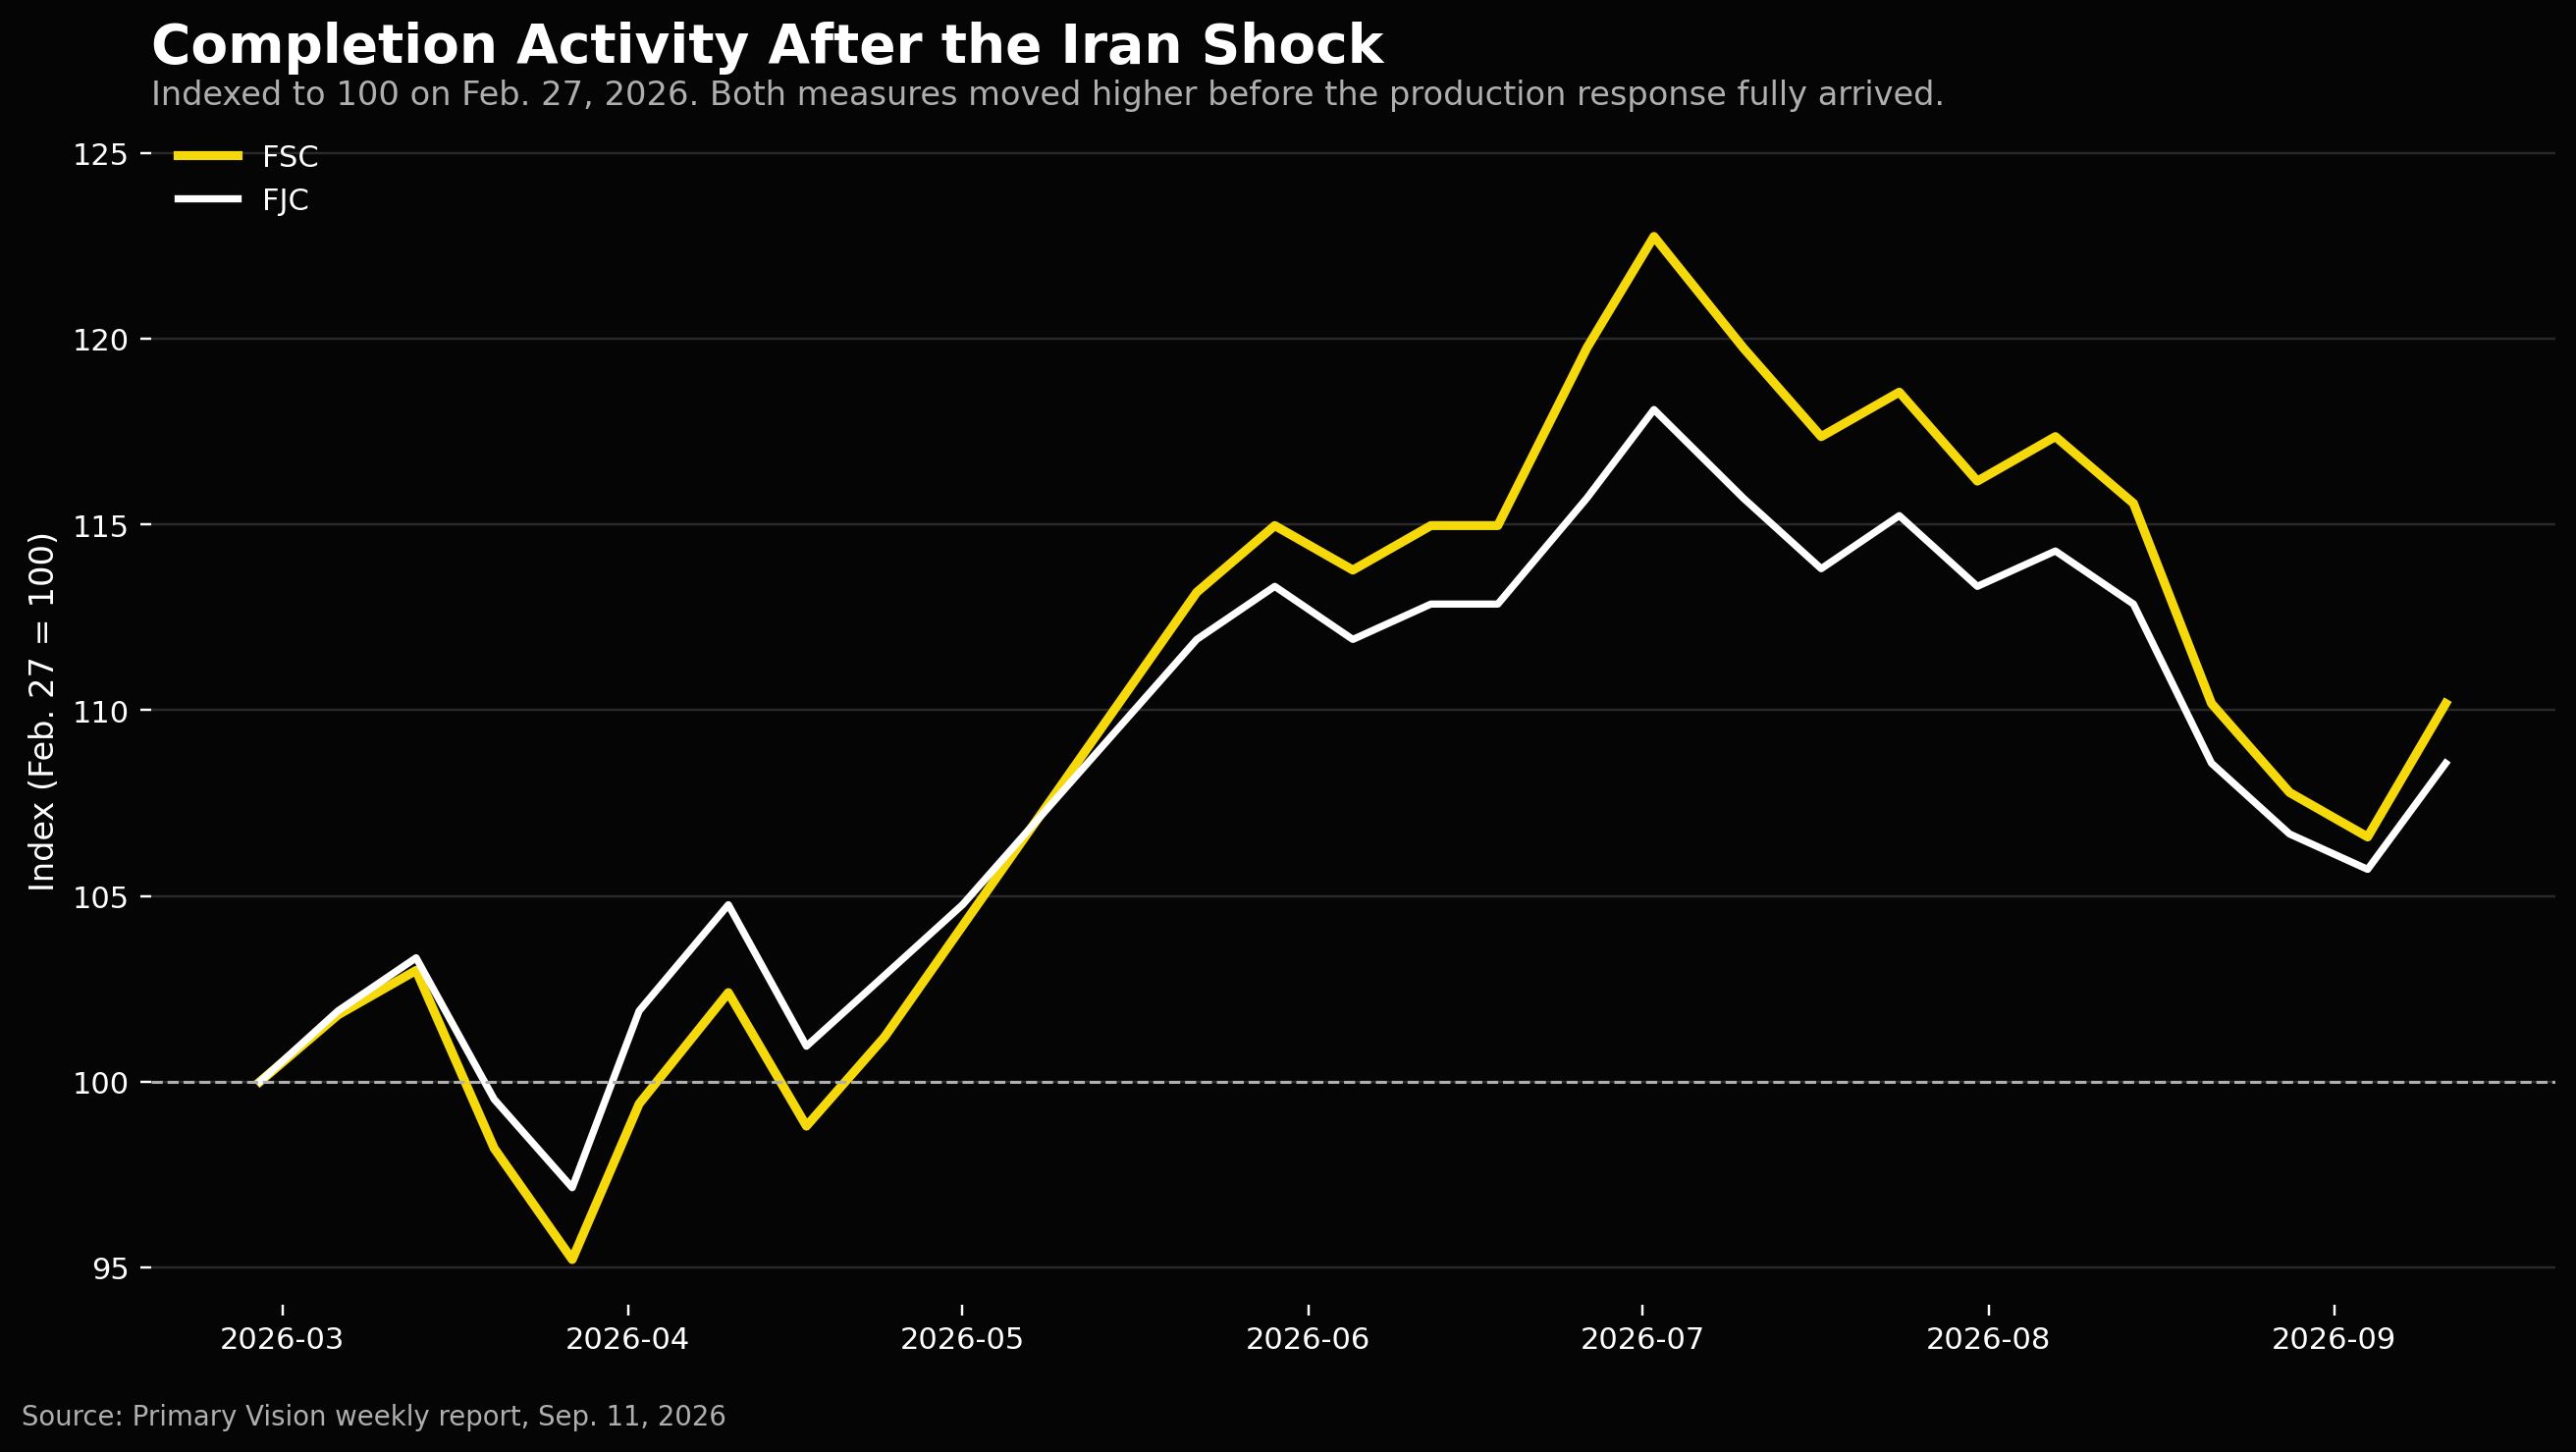
Perhaps the most interesting part of the CEPR argument is that its own evidence on completion times helps explain why these indicators matter. The article estimates a median period of roughly 5.7 months between rig arrival and first production. If that is the case, production must naturally lag the operational decisions that eventually create it. An operator responding to higher prices in March or April can change completion schedules, commit crews or accelerate an existing programme long before the resulting barrels become obvious in aggregate U.S. production.
That does not make the finding of low short-run production elasticity wrong. It simply means the conclusion should be interpreted carefully.
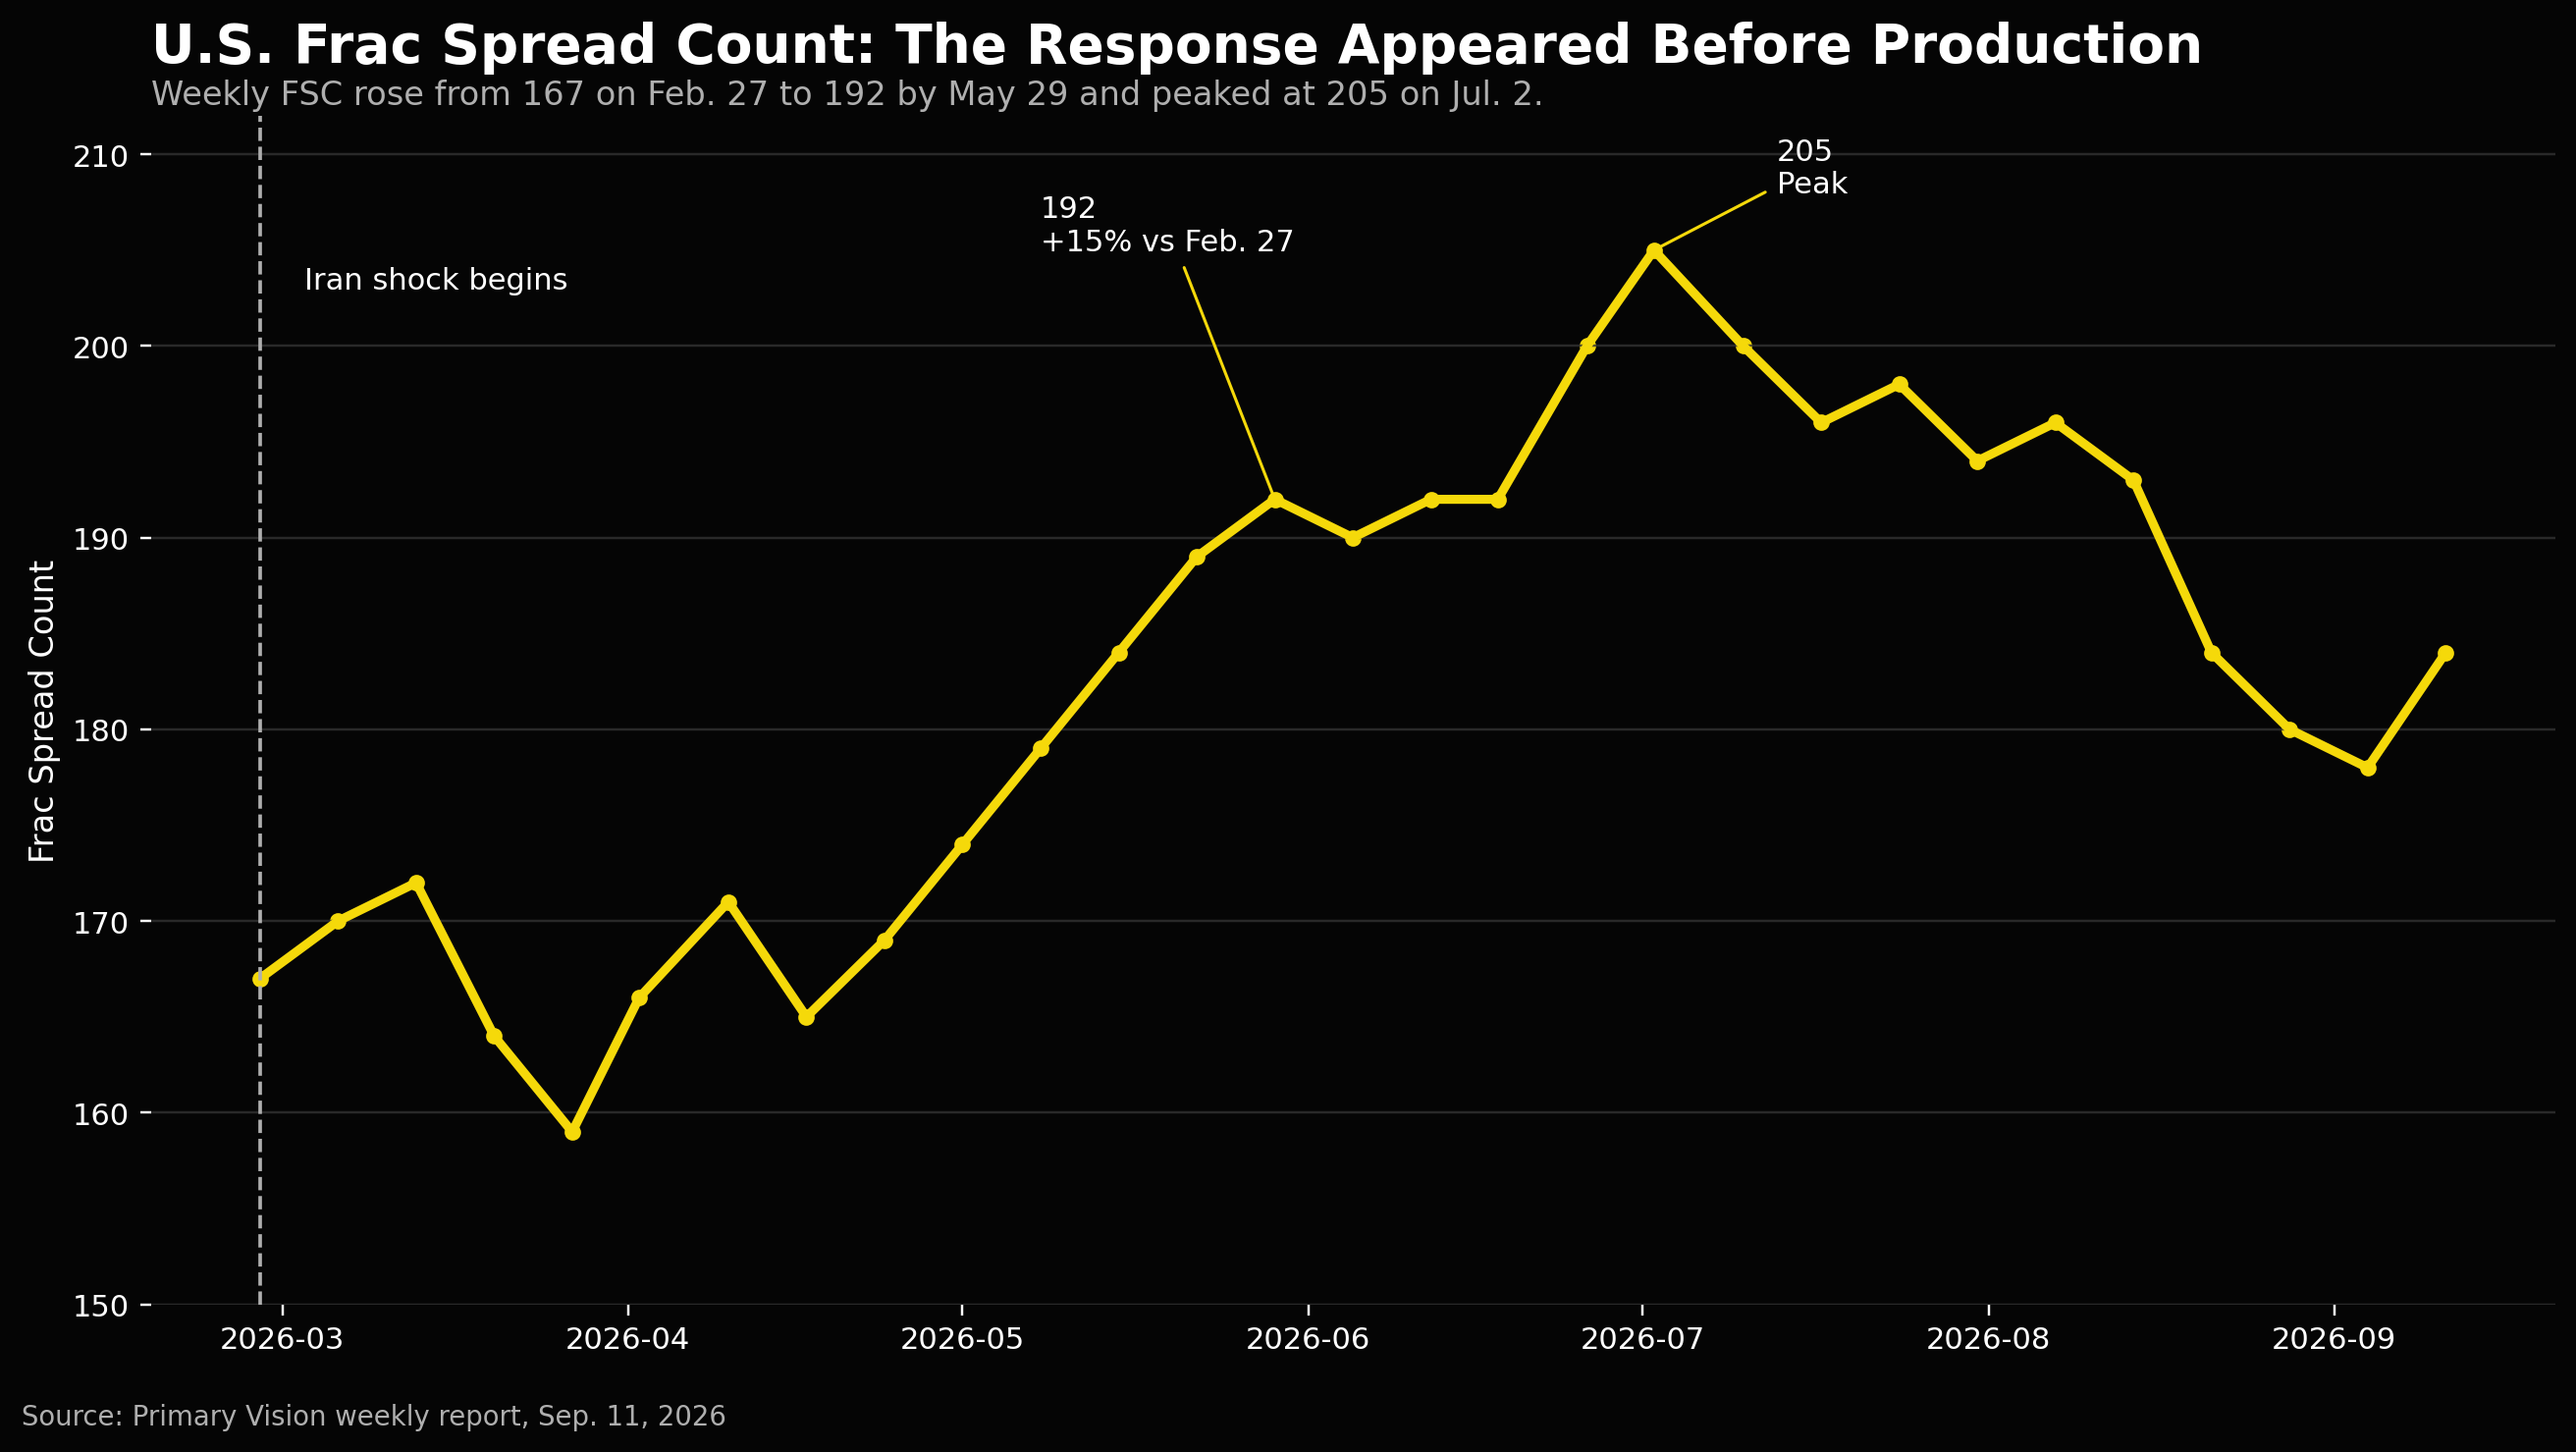
The data also shows that this response was not permanent or unlimited. Activity peaked during the summer and subsequently moderated. By September 11, FSC had fallen back to 184 and FJC to 228, although both remained above their late-February levels.
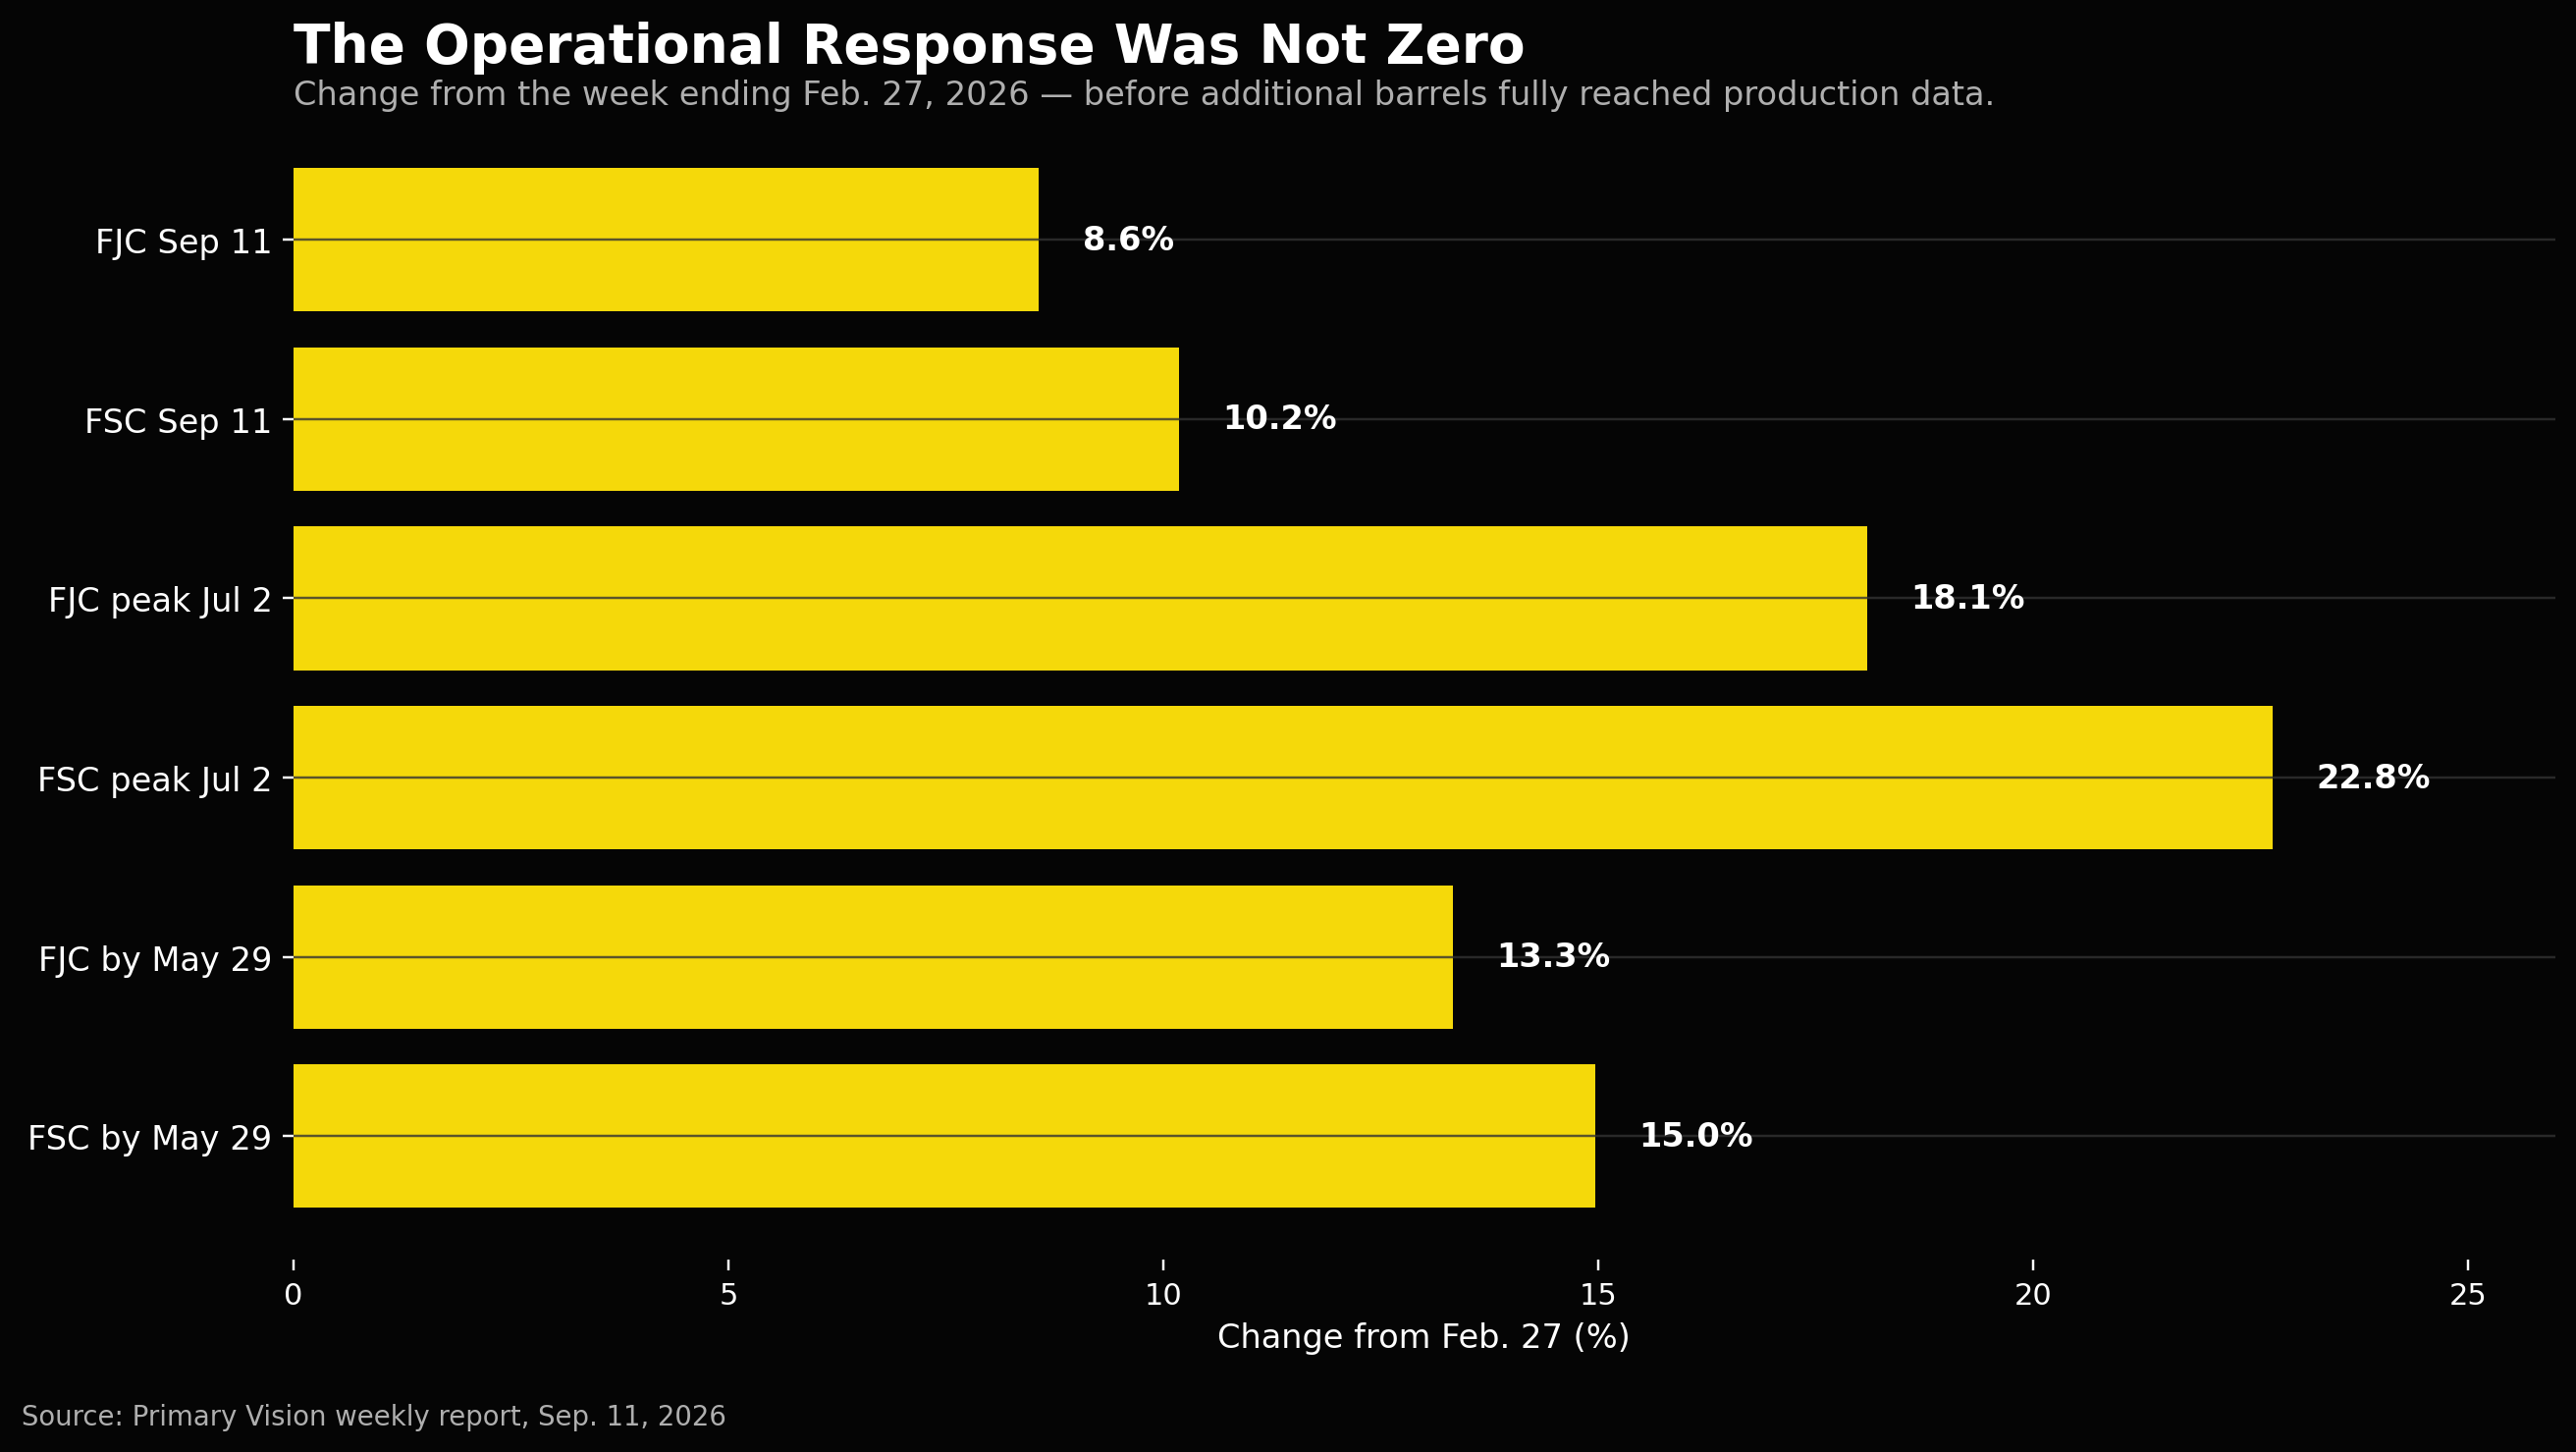
That pattern looks much more like a measured industry response than an uncontrolled rush back into growth. The lesson from 2026, then, may not be that U.S. shale can instantly replace barrels lost elsewhere in the world. It cannot. Nor does the completion data invalidate the argument that immediate production elasticity remains very low. What it does suggest is that production may be the last place where a price response becomes visible, rather than the first.
If we want to know whether U.S. shale is beginning to react to a changing oil market, we may need to spend a little less time waiting for the barrels and a little more time watching the work required to produce them.
Tags:
Permission denied
Upgrade to Pro Today and get…
• This article — plus dozens more each month, all within our full Research Module
• Frac Hits — our National-Level Frac Spread Count and Frac Job Count, updated weekly
• Frac Operator Monitor — detailed FSC & FJC by operator
• And so much more, designed to help you track, forecast, and outperform