






Articles
- BLOG / Articles / View
- Articles
Market Sentiment Tracker: Housing collapse and cost of living crisis
By Osama on October 27, 2026 in Market Sentiment
The defining feature of the current expansion is the widening distance between production, profitability and purchasing power. American companies are expanding order books while housing transactions collapse. European manufacturers are sustaining output while losing the ability to recover rising costs. Chinese technology producers are accumulating profits while property-linked industries contract. The common thread is an increasingly concentrated global profit cycle, with important consequences for equity leadership, credit quality and the durability of investment.
U.S. | Record Orders, Record Housing Weakness
Corporate pricing power is becoming an increasingly important source of American economic exceptionalism. S&P Global's October survey showed new orders reaching a five-and-a-half-year high, employment expanding at its fastest pace since June 2022 and selling prices rising at their strongest rate since August 2022. Its activity model implied annualized GDP growth of approximately 5%. Part of the demand expansion reflected precautionary inventory accumulation, suggesting that supply-chain uncertainty is pulling expenditure forward rather than generating entirely new final demand. That distinction becomes more consequential alongside the housing market. September's pending-sales index collapsed to 66.0, its lowest level since the series began in 2001. Redfin separately reported a median monthly mortgage payment of $2,796, up 10.4% annually, while active listings rose 2.1%. The combination implies a market where affordability is weakening transaction liquidity faster than sellers are reducing supply.
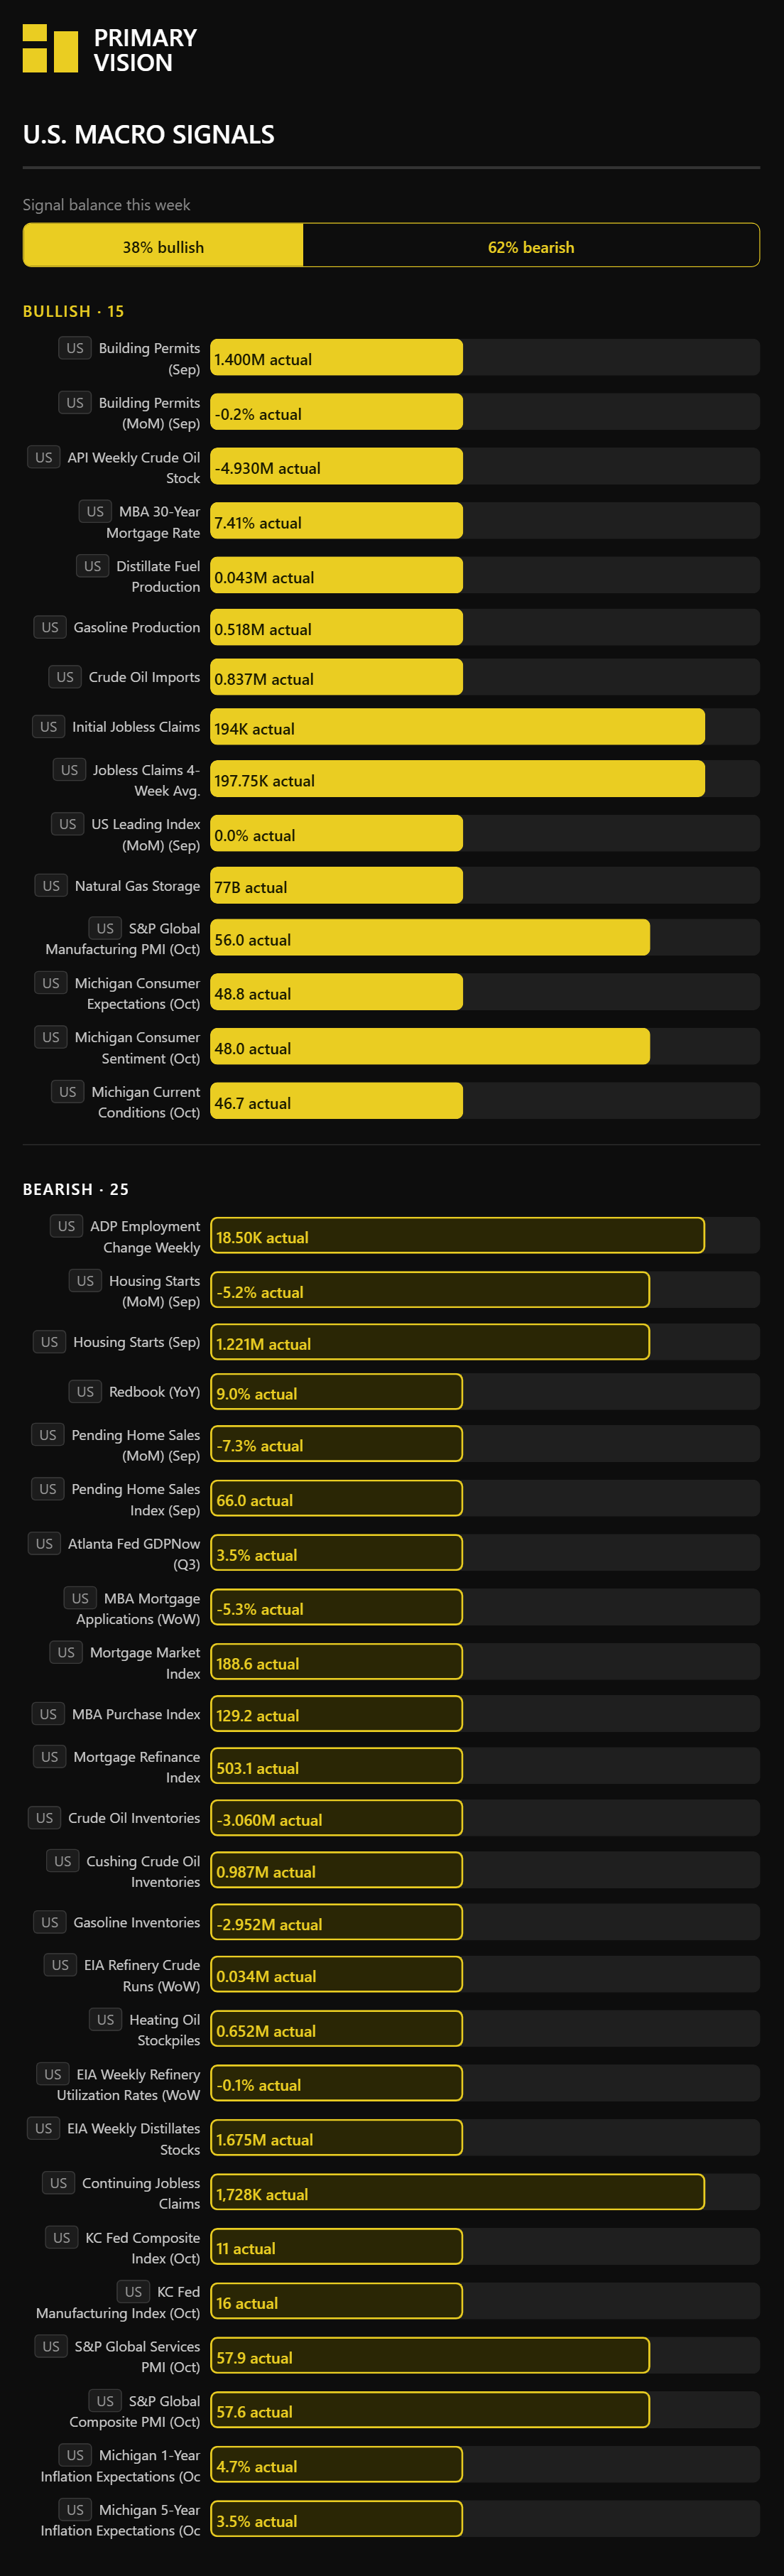
The second-order consequence reaches well beyond homebuilders. Fewer transactions weaken mortgage origination, brokerage income, furnishings demand and housing-related consumer spending, even as corporate investment supports aggregate growth. Investors therefore face an increasingly concentrated earnings expansion, with corporate order backlogs supporting industrial revenues while household-facing businesses absorb pressure. The decisive test is whether S&P Global's exceptional order growth converts into sustained final sales without further inventory accumulation, beginning with the October 29 advance third-quarter GDP release.
Europe | The Margin Squeeze Hidden Inside Industrial Recovery
European profitability is becoming more sensitive to the relationship between input costs and selling prices than to industrial output alone. October's German manufacturing PMI reached 54.2, yet the country's services index slipped to 51.7 and manufacturing-order growth eased to a three-month low. S&P Global reported that German factory confidence weakened as input prices rose, while companies across the eurozone increased selling prices more slowly despite accelerating energy and transport costs. Output resilience is therefore offering limited protection against deteriorating unit economics. France introduces a different mechanism. Its composite PMI fell to 48.4 as fiscal uncertainty and rising government borrowing costs contributed to delayed customer decisions. ING's Bert Colijn argued on October 23 that eurozone weakness remained concentrated in France, while activity elsewhere continued expanding. More broadly, eurozone export orders increased for a third consecutive month after nearly four and a half years of decline, even as total new-order growth slowed.
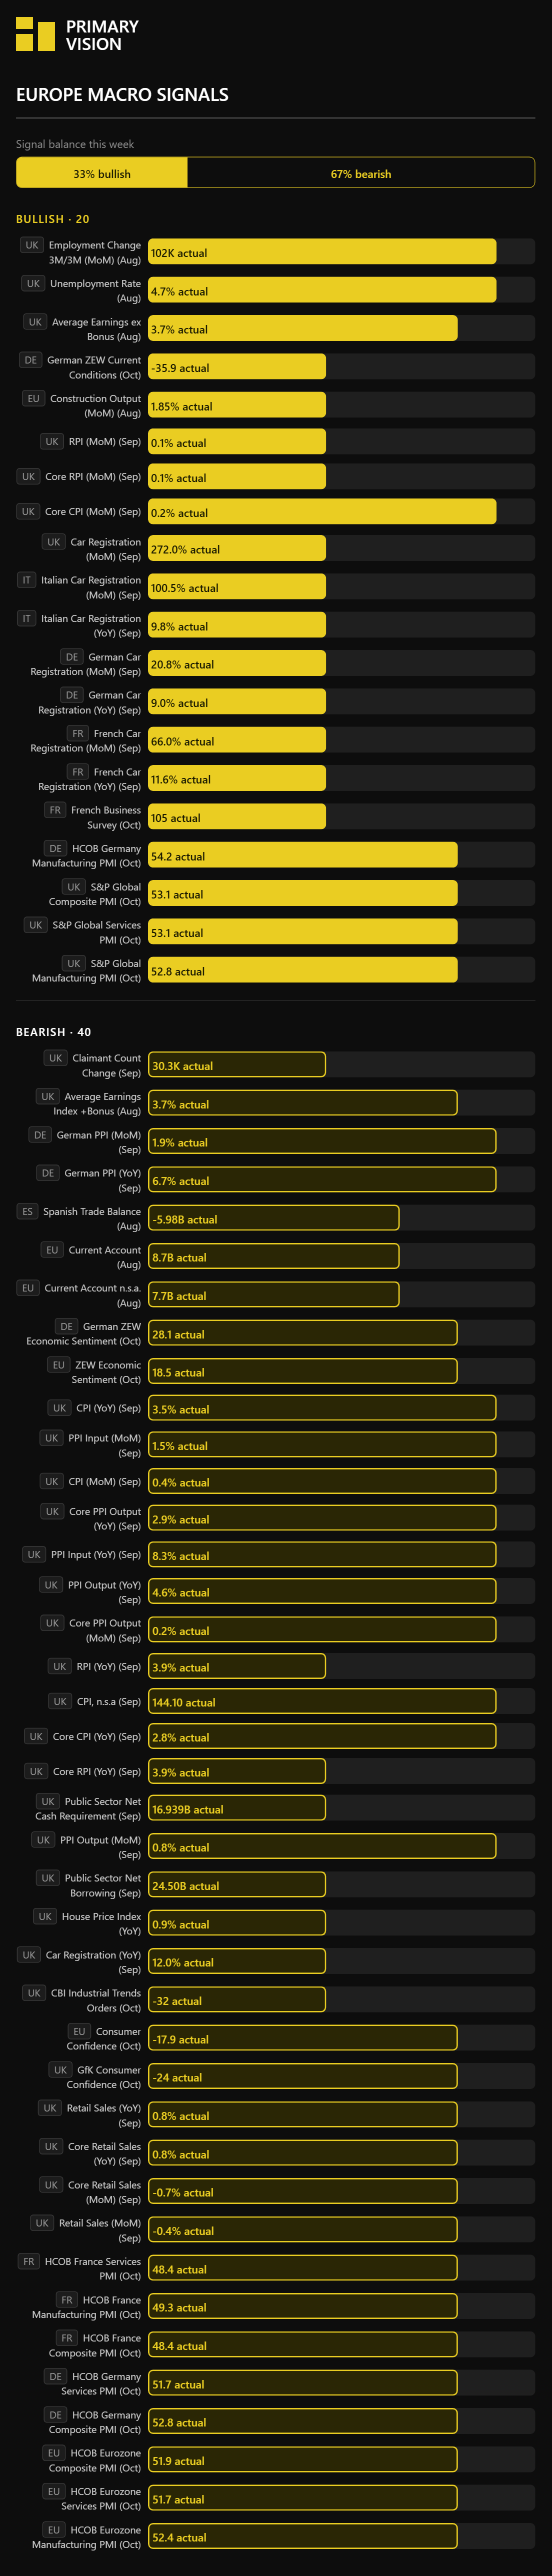
This divergence creates a potential earnings-quality problem for European equities. Export-oriented producers can sustain utilization while absorbing higher energy costs, whereas domestic service companies face clients postponing expenditure. Strong industrial volumes may consequently coexist with disappointing operating leverage, weaker cash conversion and reduced appetite for discretionary capital expenditure. The October 30 eurozone GDP release will help establish whether external demand can continue compensating for French weakness, with the 50-point PMI threshold remaining the crucial boundary for broad-based contraction.
China | The Profit Boom Is Becoming More Concentrated Than GDP
China's latest industrial-profit figures expose a sharper divergence than aggregate GDP suggests. September industrial profits accelerated 14.4% annually from 4.2% in August, according to the National Bureau of Statistics. Yet profits in computer, communications and electronic-equipment manufacturing more than doubled over January–September, while furniture manufacturers suffered declines exceeding 50%. The national profit recovery is being disproportionately generated by businesses positioned within global technology investment chains rather than industries dependent on Chinese household wealth. The underlying demand structure reinforces this concentration. September industrial output expanded 5.5%, compared with retail-sales growth of 1.1%, while property investment contracted 20.6% over the first nine months. This is particularly important for metals, construction materials and consumer durables, where expanding national production does not necessarily imply recovering domestic demand. China's improving foreign-direct-investment reading, from -5.3% to -4.3%, also leaves investment flows negative.
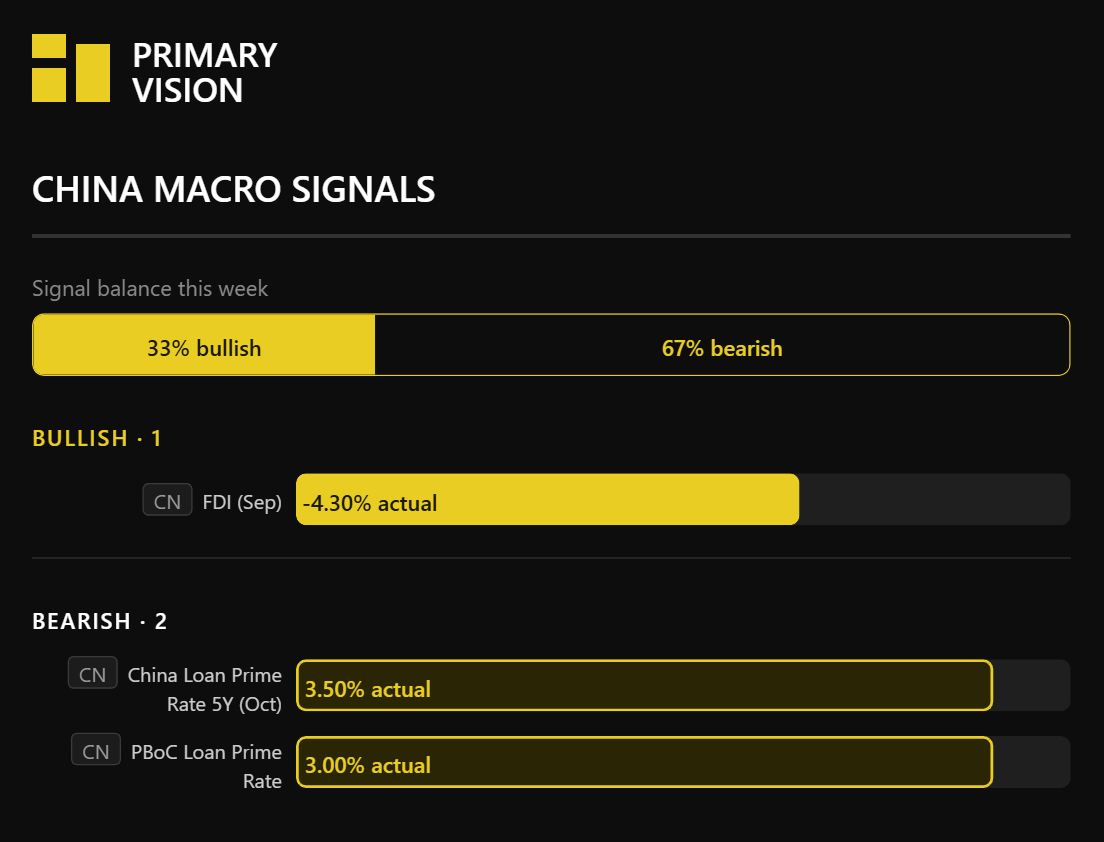
CITIC Bank International economist Ding Meng expects rapid industrial-profit growth to persist unless the global AI investment boom reverses significantly. That dependence creates an international feedback loop. American technology expenditure supports Chinese electronics profitability, while excess manufacturing capacity intensifies competition for European industrial firms already facing higher operating costs. China's profit cycle consequently depends increasingly on the investment decisions of overseas customers. The next decisive level is the 20.6% property-investment contraction, with a sustained improvement required to demonstrate that profitability is spreading beyond export-facing technology industries.
Permission denied
Upgrade to Pro Today and get…
• This article — plus dozens more each month, all within our full Research Module
• Frac Hits — our National-Level Frac Spread Count and Frac Job Count, updated weekly
• Frac Operator Monitor — detailed FSC & FJC by operator
• And so much more, designed to help you track, forecast, and outperform