







Articles
Why are U.S. natural gas prices falling?
By Osama on October 28, 2026 in Free Articles
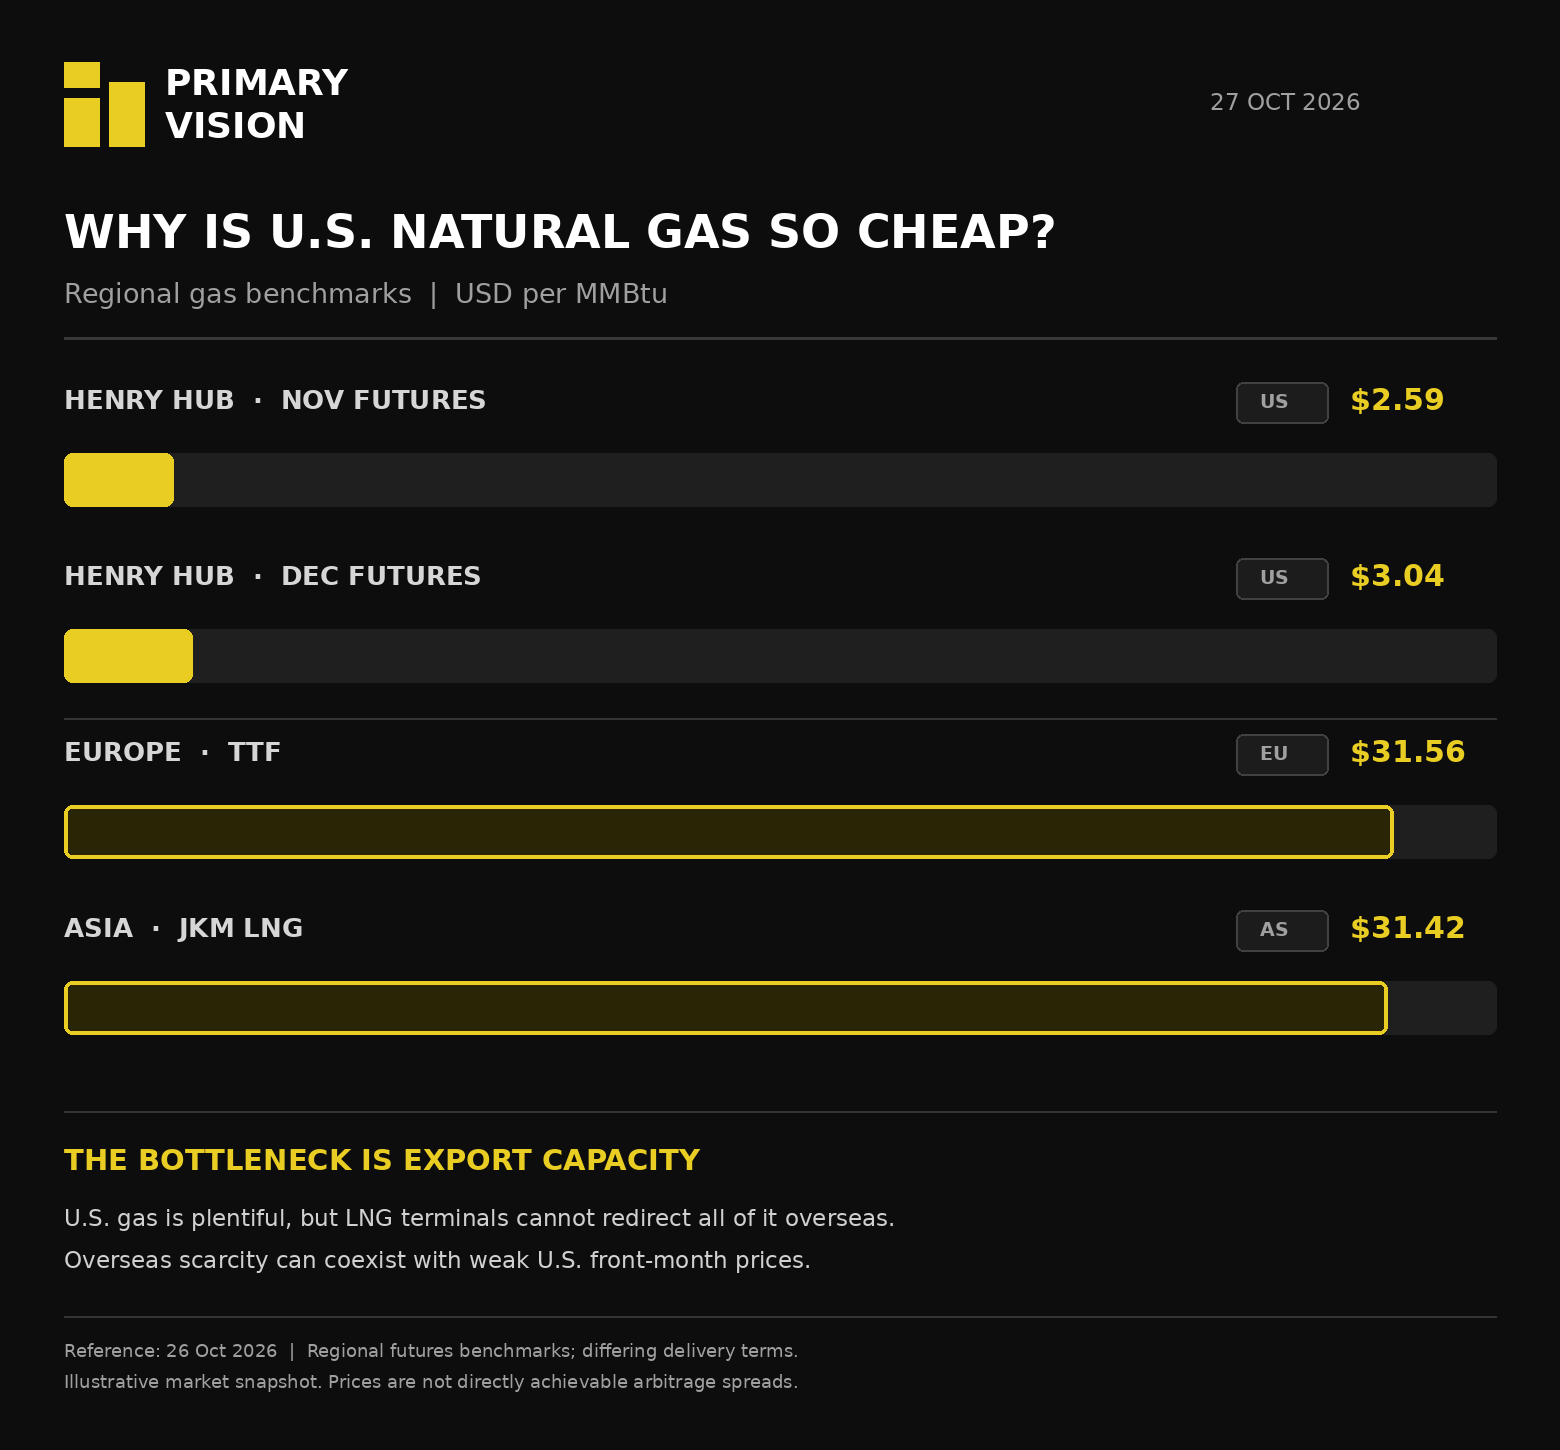
American natural gas briefly fell below $2.50 per million British thermal units on October 26, approaching its lowest level in two years. On the same day, European natural gas traded above $31/MMBtu, while Asian LNG was similarly expensive. With Middle Eastern energy infrastructure disrupted and winter approaching, why is gas becoming cheaper in the world's largest producer?
The first explanation is weather. Gas demand in the United States typically weakens during autumn, when summer air-conditioning consumption declines before winter heating requirements accelerate. Forecasts for unusually mild temperatures across much of the northern United States have reduced expectations for heating demand into early November and can be related as a major driver of the October 26 sell-off.
But weather alone cannot explain the decline. American production has also recovered toward record levels. Lower-48 output averaged approximately 113.3 billion cubic feet per day over the preceding week, matching the record monthly pace reached in August and September. October's month-to-date average remained lower, at approximately 111.6 billion cubic feet per day, indicating that the recent recovery is particularly important.
When production strengthens just as seasonal consumption weakens, additional gas must enter storage or find another buyer. That brings us to inventories. The Energy Information Administration reported 3,644 billion cubic feet of working gas in storage for the week ending October 16, following a 77-billion-cubic-foot injection. Inventories stood 35 billion cubic feet above their five-year average, although they remained 152 billion below the corresponding week in 2025.
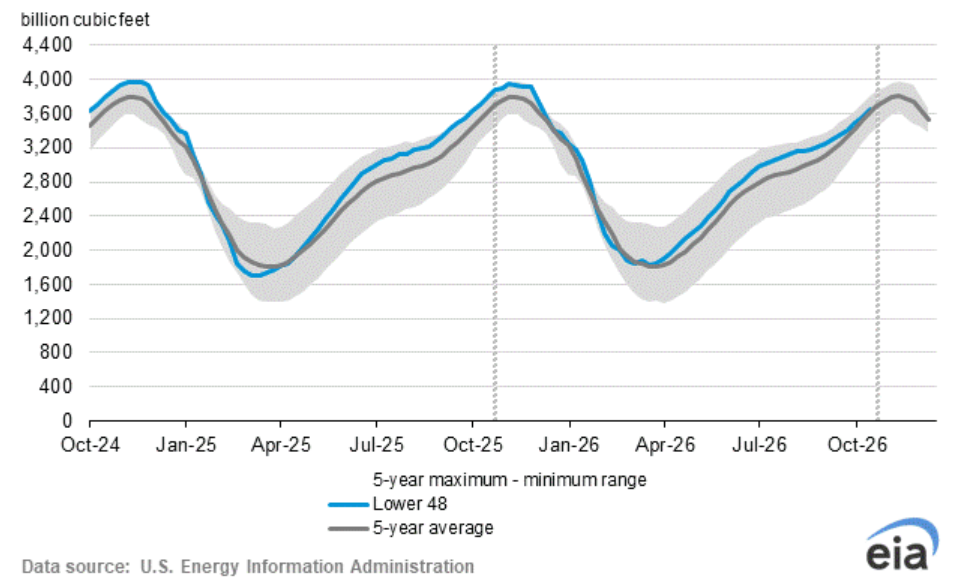
This tells us something important. American inventories are relatively comfortable for the season, but they are not exceptionally high. The recent price collapse reflects expectations about near-term supply and demand rather than overwhelming physical oversupply already sitting in storage. There is another important detail behind the headline $2.50 price. The November futures contract, approaching its October 28 expiry, briefly touched $2.497 on October 26 before recovering to approximately $2.59. The December contract traded closer to $3.04. That premium indicates that gas for delivery later in the heating season was already valued more highly than near-term supply. Historical futures data support the November decline.
The more interesting question is why American producers cannot simply redirect their abundant gas toward Europe and Asia, where buyers are paying vastly higher prices. Unlike crude oil, natural gas requires specialized infrastructure for overseas transport. It must be liquefied at approximately minus 162°C, transported aboard LNG carriers and converted back into gas at importing terminals. Liquefaction capacity, pipeline access and shipping availability determine how much American supply can reach international markets.
U.S. LNG export terminals were already receiving approximately 18.2 billion cubic feet per day in October, compared with 17.9 billion in September and an April record of 18.8 billion. Exports are therefore absorbing substantial domestic production, but the system cannot instantaneously expand to capture every dollar of the international price premium. Europe faces the opposite problem. Disruptions involving Middle Eastern LNG shipments have intensified competition for replacement cargoes, while European storage was only 74.6% full on October 25, substantially below its seasonal norm. European benchmark gas prices exceeded $31/MMBtu on October 26, reflecting concerns over winter availability.
This produces an unusual commercial outcome. American upstream producers receive relatively weak domestic prices, while LNG exporters can benefit from access to much more expensive international markets. The headline difference between Henry Hub and overseas benchmarks is substantial, although liquefaction, shipping, financing and contract arrangements prevent exporters from capturing the entire spread. The consequences extend into manufacturing. Cheap American gas supports the economics of fertilizers, petrochemicals and other energy-intensive industries, while European competitors face considerably higher input costs. The international energy crisis can therefore strengthen America's relative industrial cost advantage even as domestic gas producers experience weaker revenues.
The next test comes on October 29, when the EIA publishes updated storage figures. More importantly, November temperatures and the pace of winter withdrawals will establish whether October's weakness was temporary or the beginning of a more persistent domestic surplus.
The central implication is that natural gas prices increasingly reflect access to infrastructure as much as access to supply. The United States has abundant production, while Europe and Asia face expensive replacement supplies. Until additional gas can move freely between these markets, domestic price weakness and international scarcity can coexist.